
Figure 2.
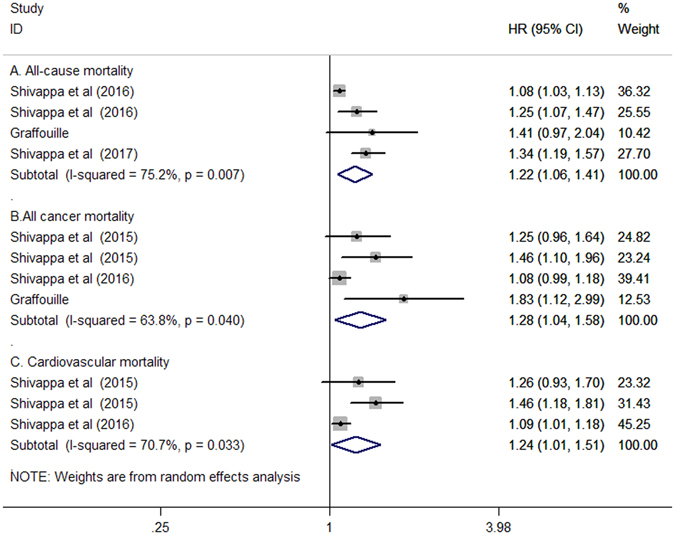
Forest plots showing HR with 95% CI of all-cause mortality (A), cancer-related mortality (B), and cardiovascular mortality (C) comparing the highest to the lowest dietary inflammatory index score.
Official websites use .gov
A
.gov website belongs to an official
government organization in the United States.
Secure .gov websites use HTTPS
A lock (
) or https:// means you've safely
connected to the .gov website. Share sensitive
information only on official, secure websites.
Forest plots showing HR with 95% CI of all-cause mortality (A), cancer-related mortality (B), and cardiovascular mortality (C) comparing the highest to the lowest dietary inflammatory index score.