Fig. 4.

(R)-[11C]PK11195 PET uptake (mean ± SE) in the brainstem (left) and in the cerebral cortex (right). Both regions revealed a statistically significant difference between groups in the overall analysis

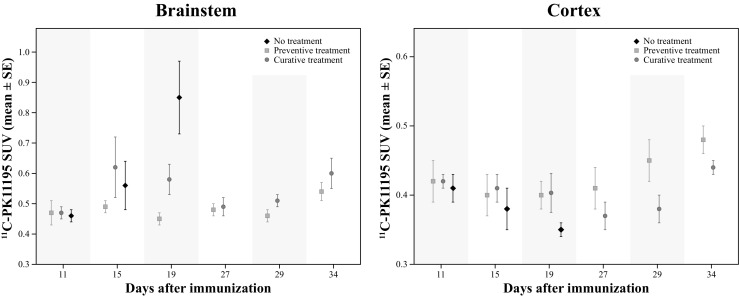
(R)-[11C]PK11195 PET uptake (mean ± SE) in the brainstem (left) and in the cerebral cortex (right). Both regions revealed a statistically significant difference between groups in the overall analysis