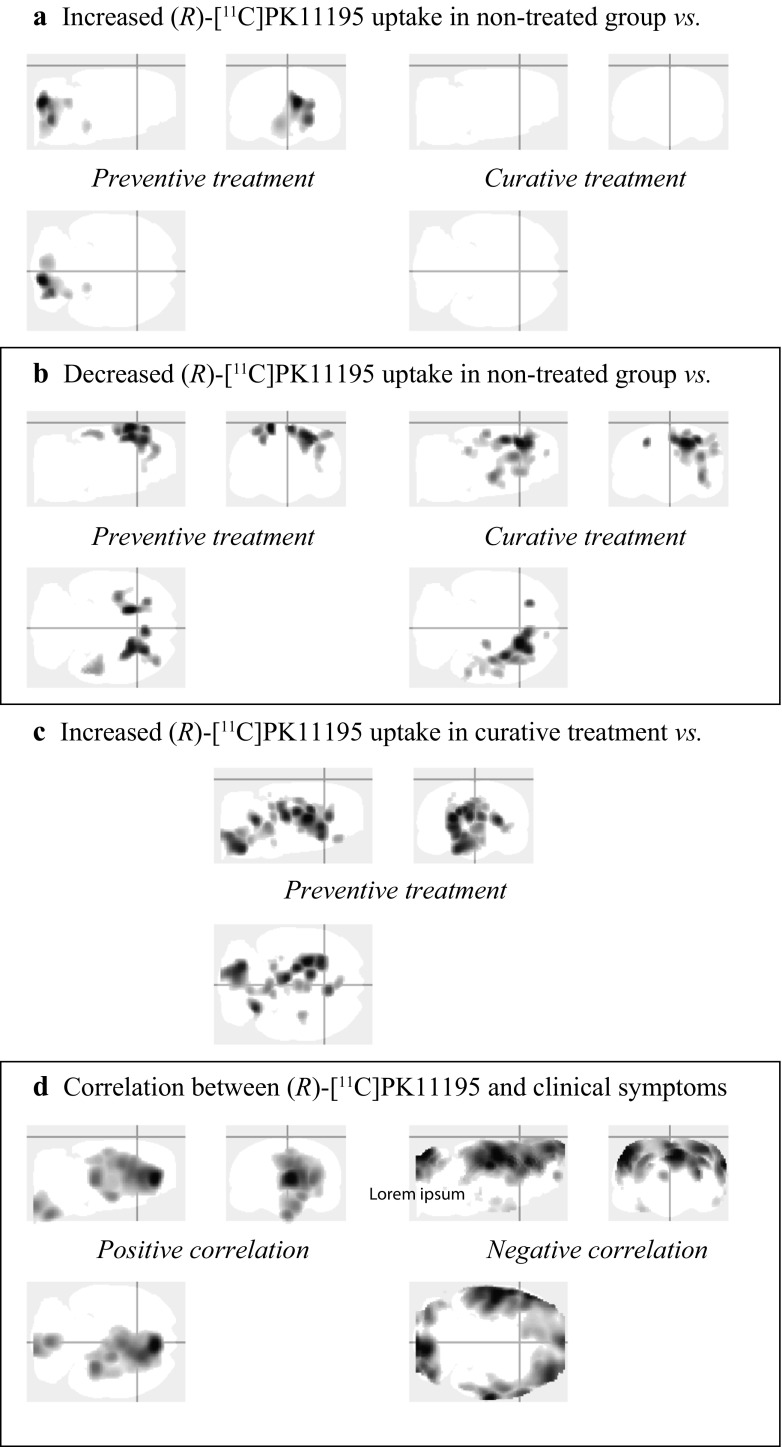
Fig. 5.
Maximum intensity projection (i.e. ‘glass-brain’ display) of the voxel-based analysis. At day 19, regions with a statistically significant a increase and b decrease of (R)-[11C]PK11195 uptake in the non-treated group when compared with the preventive (left panels) and curative (right panels) treatment groups. c At day 19, regions with a statistically significant increase of (R)-[11C]PK11195 uptake in the curative treatment group when compared with the preventive group. d Correlation of the clinical score with the (R)-[11C]PK11195 PET uptake, including all time points and groups

