
Figure 4.
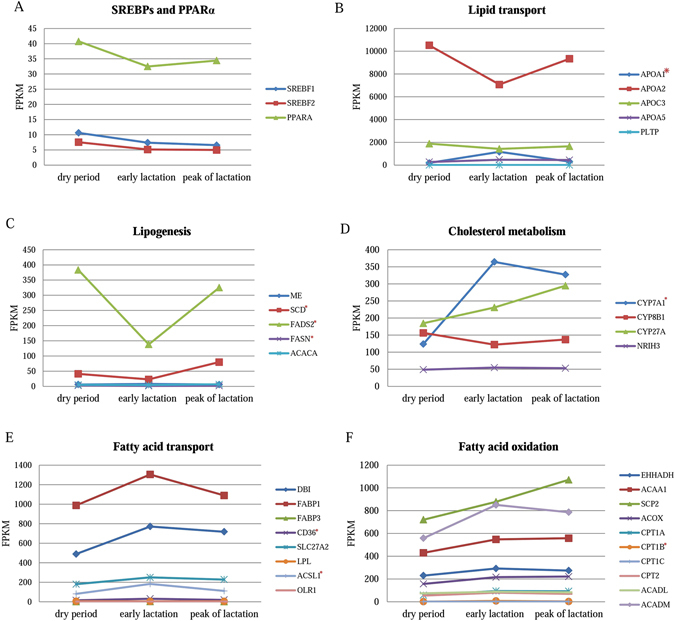
Expression profiles of the lipid metabolic genes during dry period, early lactation, and peak of lactation. The expression levels of lipid metabolic genes are shown based on FPKM values; the genes are divided into SREBPs and PPARα (A), lipid transport (B), lipogenesis (C), cholesterol metabolism (D), fatty acid transport (E), and fatty acid oxidation (F) categories; and the differentially expressed genes are labeled with an asterisk.