
Fig. 4.
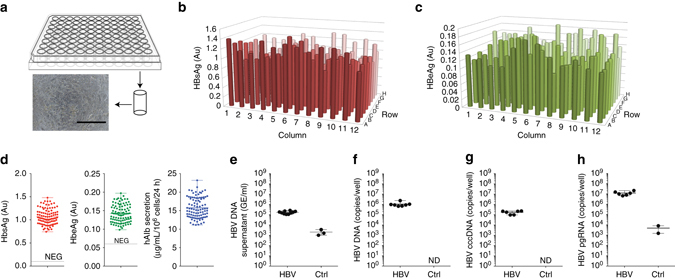
Robust HBV infection SACC-PHHs in microwell formats. a Schematic depiction and representative bright-field image of the microwell SACC-PHH system (scale bar = 400 μm). Quantification of HBsAg b and HBeAg c across the 96-well format at 10 dpi (day 20 post seeding). d Limited variation of HBsAg (left, mean 1.070 Au, std 0.167 Au, two tail t-test p-value < 0.0001, compared to 1 Au), HBeAg (middle, mean 0.142 Au, std 0.024 Au, two tail t-test p-value < 0.0001, compared to 0 Au) and hAlb (right, mean 15.75 μgml per 106 cells per 24 h, std 2.679 μgml per 106 cells per 24 h, two tail t-test p-value < 0.001, compared to 15 μgml per106 cells per 24 h) at 10 dpi. Quantification of HBV DNA in culture supernatants e at 10 dpi, and total HBV DNA f, cccDNA g and pgRNA h in cell lysates of randomly picked wells at 30 dpi. For HBV DNA and RNA quantifications six to ten replicates were performed. For HBsAg, HBeAg, and hAlb 96-biological replicates were performed. All data are presented as means ± s.d