
Fig. 3.
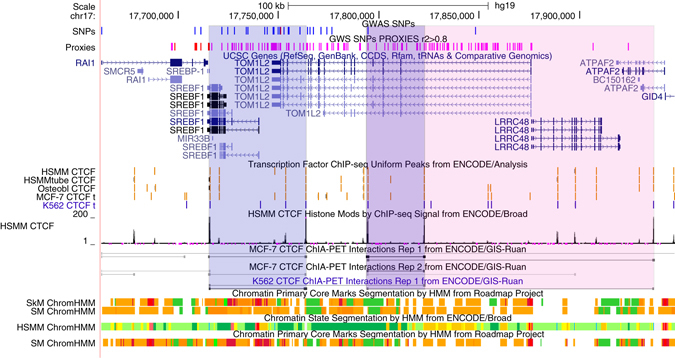
17p11.2 locus displaying binding peaks and interaction tracks by CTCF ChIA-PET data together with histone marks based on chromatin state characterization. Predicted strong interactions shared in MCF-7 or K562 cell lines are shadowed in blue while a weaker interaction in both cell lines is shadowed in pink. These interactions overlap with predicted CTCF binding sites in osteoblast, myoblast and myotubes, hypothetically localizing SNPs in TOM1L2 close to transcribed regions in SREBF1 and ATPAF2. Histone markers in muscular cells display high representation of associated SNPs in active enhancer predicted regions. Chromatin states are defined as follows, Bright Red: Active Promote, Orange: Strong enhancer, Yellow: Weak/poised enhancer, Blue: Insulator, Dark Green: Transcriptional elongation, Light Green: Weak transcribed