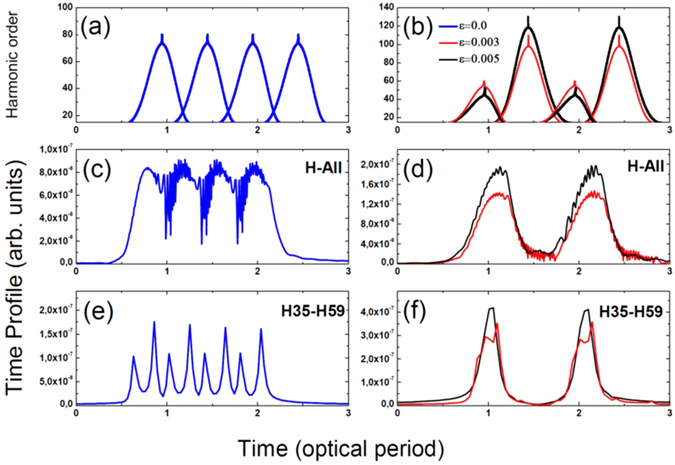
Figure 3.

Time profile of high-order harmonic spectra using same parameters as in Fig. 2. Panels (a) and (b) show the harmonic order as a function of the recombination times of the electron. In panels, (c) and (d) the train of pulses emitted from all the harmonics presented in Fig. 2 are reported, while panels (e) and (f) present the train of the pulses emitted from 35st to 59st harmonics. Blue, red and black color curves depict the cases with ε = 0, ε = 0.003 and ε = 0.005, respectively.
