
Figure 4.
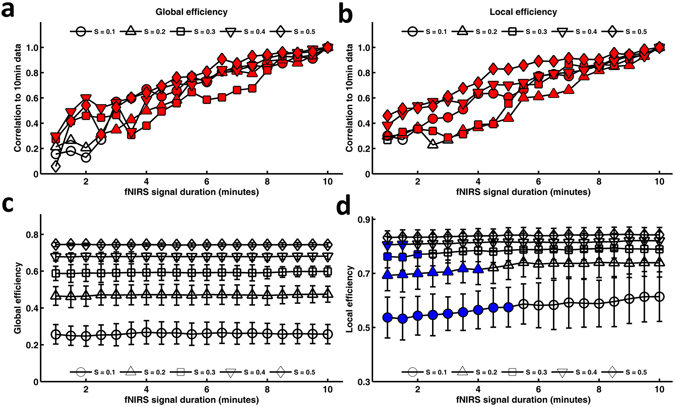
Effect of fNIRS signal acquisition duration on the accuracy and stability of global efficiency and local efficiency. The plots of the correlation strength calculated for global efficiency (a) and local efficiency (b) between short and long (10.0 min) signal durations. The red-filled circles indicate a significant correlation between global/local efficiency calculated with short and long (10.0 min) fNIRS signal acquisition durations. For both global and local efficiency, the analyses revealed significant (P < 0.001) and strong correlations for almost all threshold conditions. Magnitudes of the global efficiency (c) and local efficiency (d) plotted according to the duration of the fNIRS signal acquisition (1.0~10.0 min with 30-sec bins). The blue-filled shapes indicate a significant difference in the magnitude of the computed value associated with a given fNIRS signal acquisition duration compared with the magnitude when computed using 10.0 min of fNIRS data.