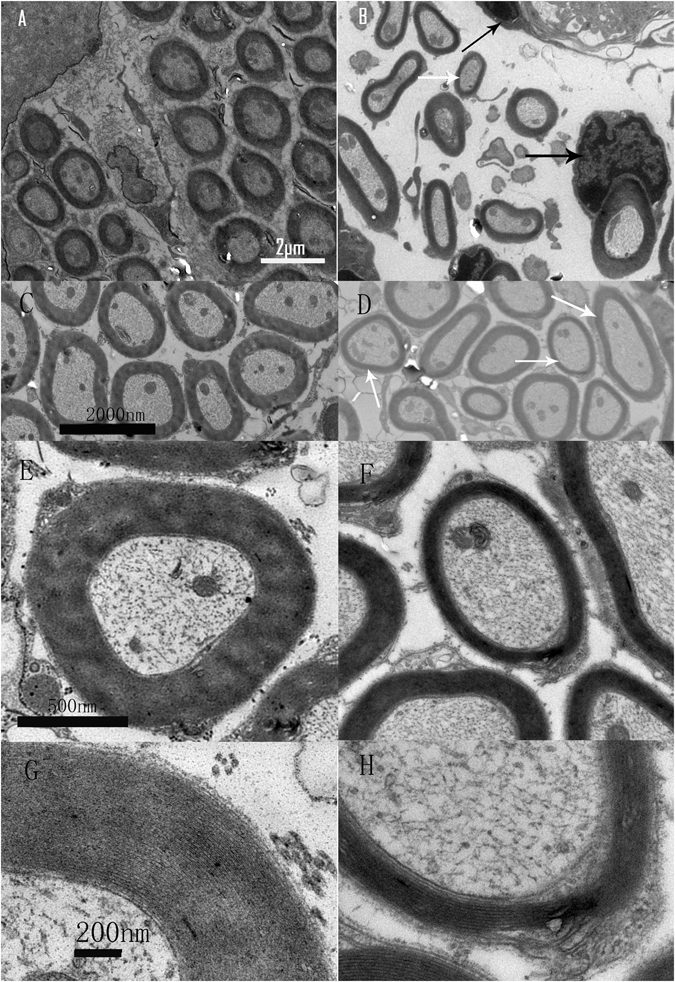
Figure 6.

TEM images showing DT-induced ANF damage. Magnification was 6000×, 20000×, and 50000× in A–D, E and F, and G and H, respectively. The images in the left and right columns are from the control and Cre+ groups, respectively. The cross sections of ANFs were in regular round shape (A,C) with relatively even thickness of myelin sheaths, in contrast to the irregular shape and uneven thickness of myelin sheaths in the images from the Cre+ group (B,D). The white arrows in (B and D) point to nerve fibers whose myelin sheath was peeling off. Additionally, extremely swollen Schwann cells were seen in the Cre+ sample (black arrows in B and D). The images of higher magnification (E–H) show that the myelin sheaths in the Cre+ sample is thin (F) and loosely packed (H) as compared with the control sample (E and G).
