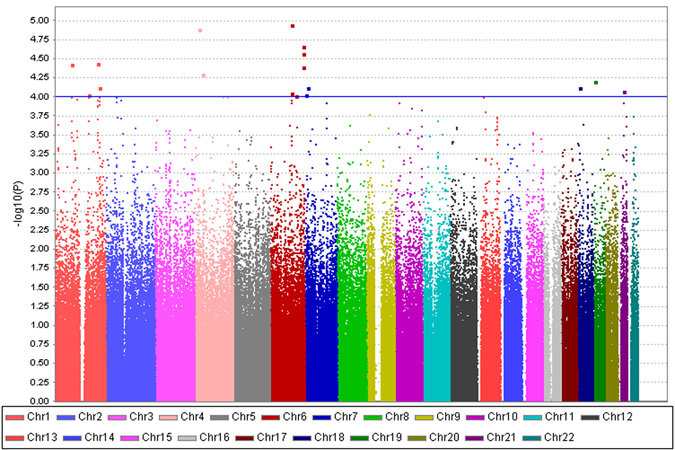
Figure 1.

Manhattan plot of a genome-wide association study for the age at onset of schizophrenia performed in 94 probands from multiplex families with the earliest AAO and those with 91 the latest AAO. The x-axis is the chromosomal position, and the y-axis is the significance of the association represented by -log10(P-value) derived from multiple logistic regression analyses. The horizontal blue line shows the significance threshold at -log10(P-value) >4 for candidate SNPs.
