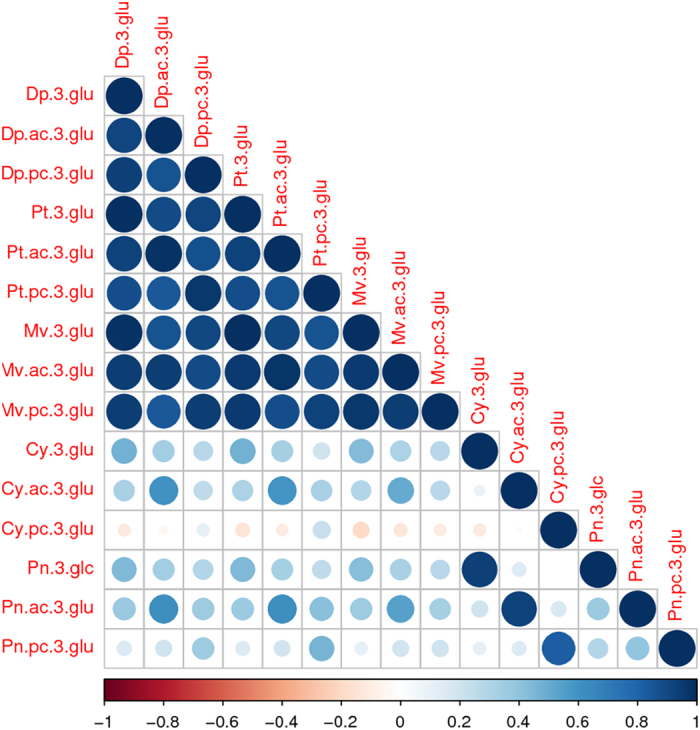
Figure 2.

Correlation matrix of all anthocyanins in the control grape cell cultures. The shape and the color of each dot in the triangular matrix show the strength of Pearson correlation (positive or negative) between pairs of anthocyanins. Positive strong correlations stand out in dark blue. Lighter colors indicate weaker relations between the metabolites.
