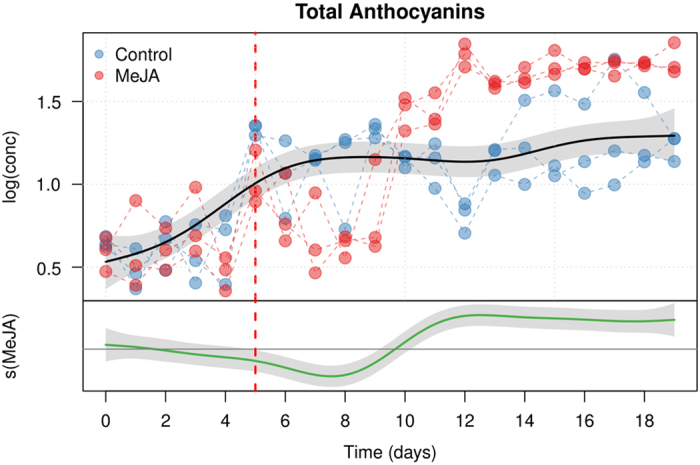
Figure 3.

Modeling of the time-dependent concentration of anthocyanins in V. vinifera (L.) cv. Gamay cell suspensions elicited with MeJA. The upper plot shows the fitted smooth of the common trend (scm(t)), while the lower graph (MeJA) shows the additional effect of the MeJA term (sMeJA(t)). The shaded area of the trends are the 95% confidence intervals of the fitted smoothers. The day of MeJA elicitation is indicated by a red dashed line.
