Figure 2.

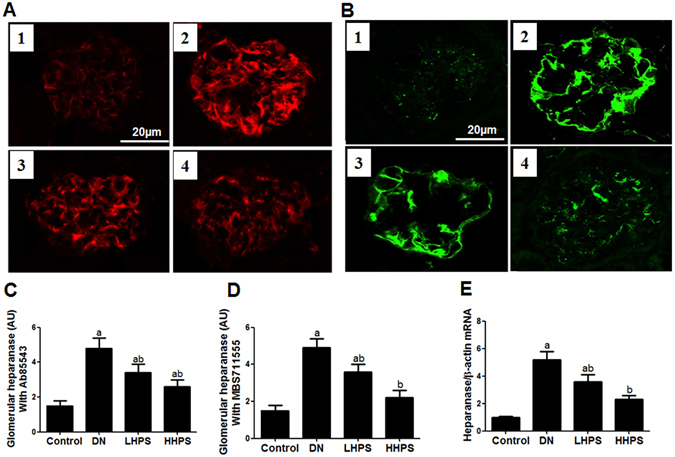
Hyperoside pre-treatment attenuated glomerular heparanase expression in DN mice (n = 5). (A) The glomerular heparanase expression was determined by immunofluorescence staining using the heparanase primary antibody (Ab85543) detecting 65 kD precursor as well as the 50 kD and 8 kD subunits of heparanase followed by rhodamine conjugated secondary antibody. (B) The heparanase primary antibody (MBS71555) followed by FITC conjugated secondary antibody was used to show 65 kD heparanase. 1:Control; 2:DN; 3:LHPS; 4:HHPS. (C,D) Quantification was performed by NIH Image software and shown in columns. (E) The columns showed the amount of heparanase mRNA levels relative to β-actin. Data are presented as mean ± SD. P < 0.05 is statistically significant. aIndicates significant vs. Control, bindicates significant vs. DN.
