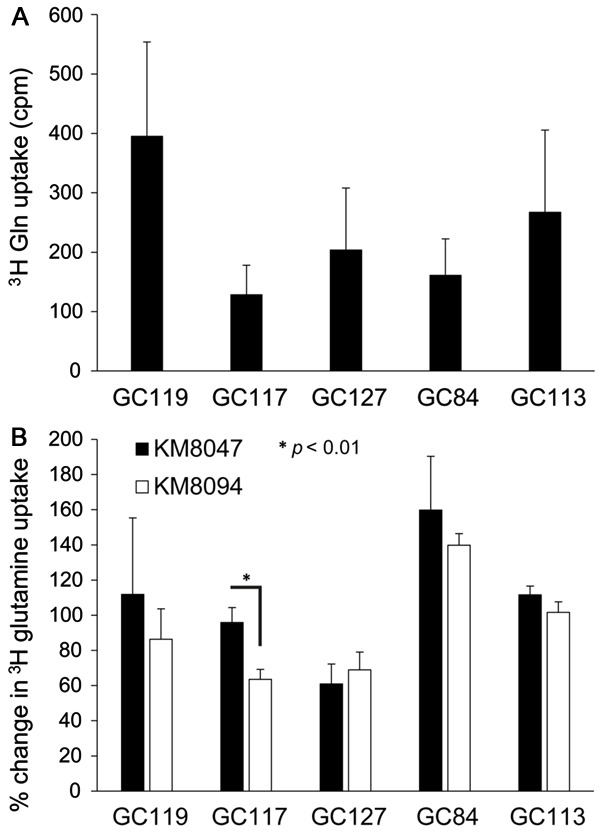
Figure 2.

The effect of KM8094 on glutamine uptake in gastric cancer patient-derived xenograft mouse models. A. Basal level of 3H glutamine uptake in PDX lines. The graph represents the average values (in count per minute) obtained from 2-5 individual experiments for each PDX line. B. Inhibition of 3H glutamine uptake in PDX lines by 30 µg/ml KM8047 or KM8094. The results are shown on the graph as a percentage change from the basal level (no antibody treatment) of 3H glutamine uptake in each PDX line. The graph represents the average percentage change obtained from 2-5 individual experiments for each PDX line. Bars represent standard deviation.
