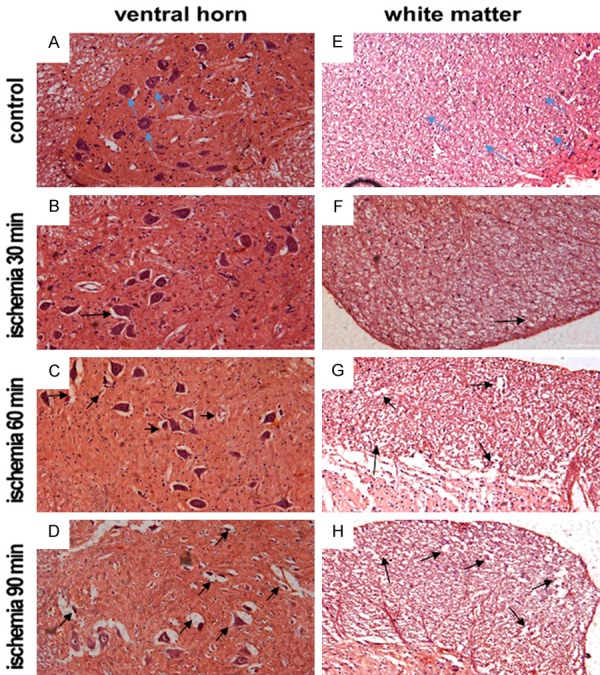
Figure 2.

Histological analyses of spinal cord sections following SCIR. A-D. H&E staining of the ventral horn of spinal cord area at 3 days post reperfusion. A. Control group; B. Ischemia for 30 min group; C. Ischemia for 60 min group; D. Ischemia for 90 min group. E, F. H&E staining of the white matter of spinal cord area at 3 days post reperfusion. E. Control group; F. Ischemia for 30 min group; G. Ischemia for 60 min group; H. Ischemia for 90 min group. Blue arrows indicate the normal neurons and neurite; black arrows indicate the edema area and necrotic neurons.
