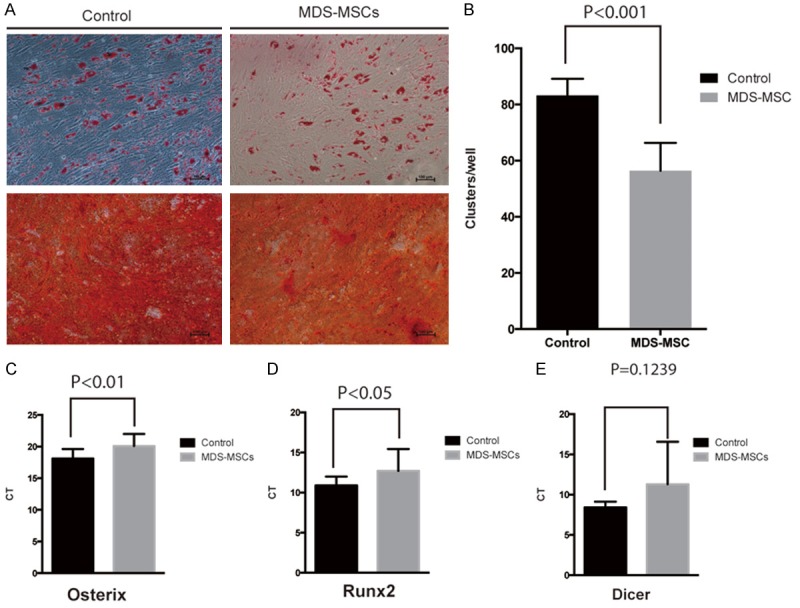
Figure 2.

MDS MSCs showed reduced osteogenic differentiation potential. A. Mineralization in treated cells was revealed by Alizarin Red S staining. Lipid vacuoles were stained with Oil Red O for adipogenic differentiation. Representative images from one MDS MSCs and control MSCs were shown. B. Statistical analysis of adipogenic clusters. Total adipogenic clusters per well (6 well pates) were counted from control MSCs and MDS MSCs. Five wells from each group were analyzed. P<0.001, student t-test. C. Quantitative PCR of Osterix gene in MDS MSCs and controls. D. Quantitative PCR of Runx2 gene in MDS MSCs and controls. E. Quantitative PCR of Dice gene in MDS patients derived MSCs and controls.
