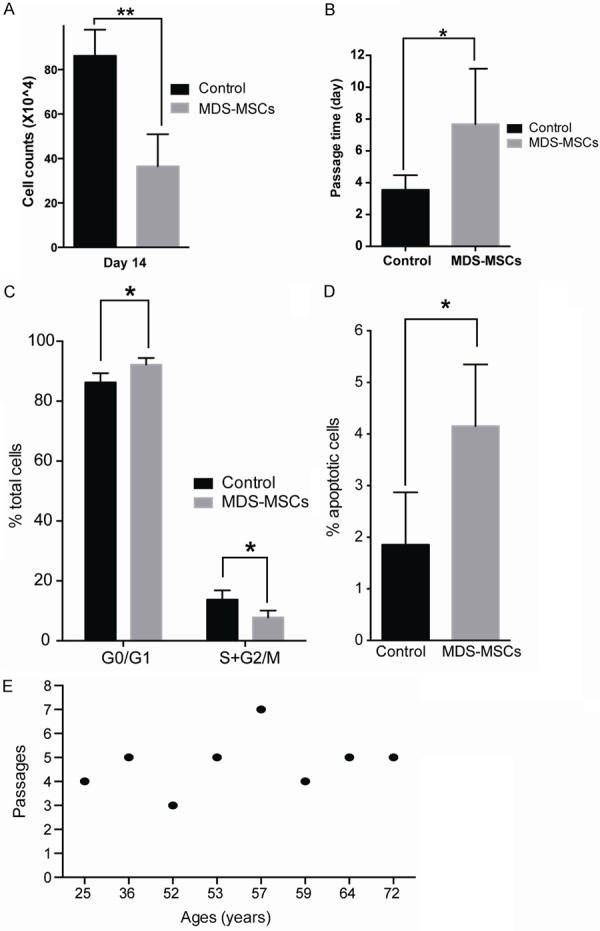
Figure 3.

Proliferation assay showed much lower growth rates of MDS MSCs in vitro culture. A. The yields of MDS MSCs are significantly less than those from control counterparts. 50,000 cells were used as individual inputs. Cells were counted at day 14 by trypan blue staining. MDS MSCs samples, n=8, control samples, n=6, P<0.001, student t-test. B. Passage times of MDS MSCs are significantly longer than control counterparts. MDS MSCs samples, n=9, control samples, n=10, P<0.01, student t-test. C. Cell cycle analysis. MDS MSCs samples, n=5, control samples, n=7, P<0.01, student t-test. D. Apoptotic analysis. MDS MSCs samples, n=6, control samples, n=4, P<0.01, student t-test. E. Relation between patient ages and MSCs passages.
