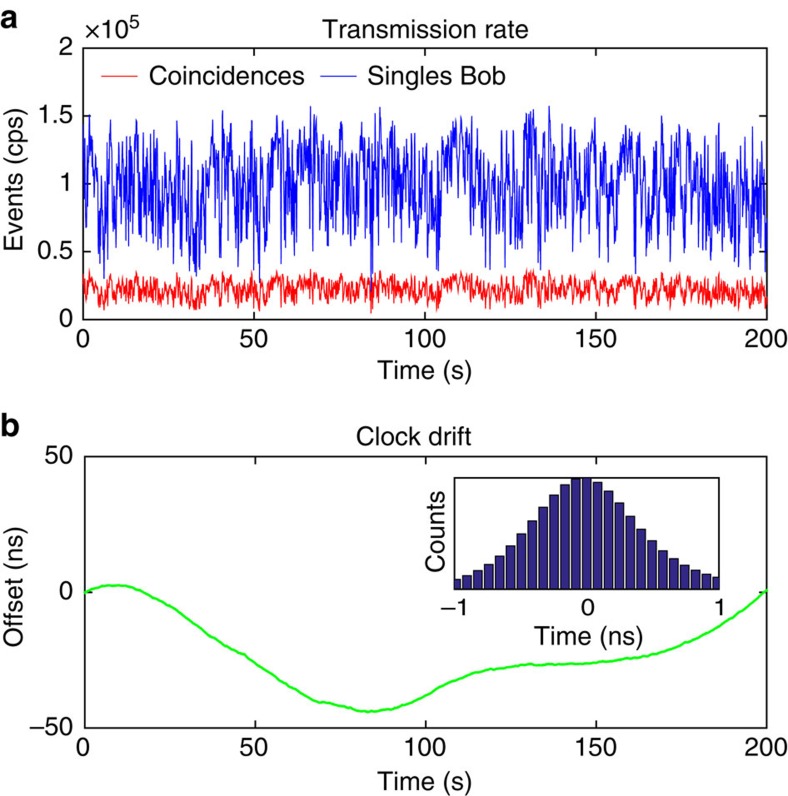
Figure 2. Transmission rate and clock drift.
(a) Average single-photon (blue line) and two-photon (red line) detection rate (100 ms integration time) after 1.2-km-long free-space transmission. The short-term signal fluctuated due to atmospheric turbulence, whereas the time-averaged rate of ∼20 kcps remained almost constant over several hours. (b) Relative clock drift between Alice and Bob. The inset depicts the normalized histogram of two-photon detection events in 80 ps time bins centred around the flight-time offset of ∼3.94 μs. All data acquired for night-time operation on 25–26 April 2016.

