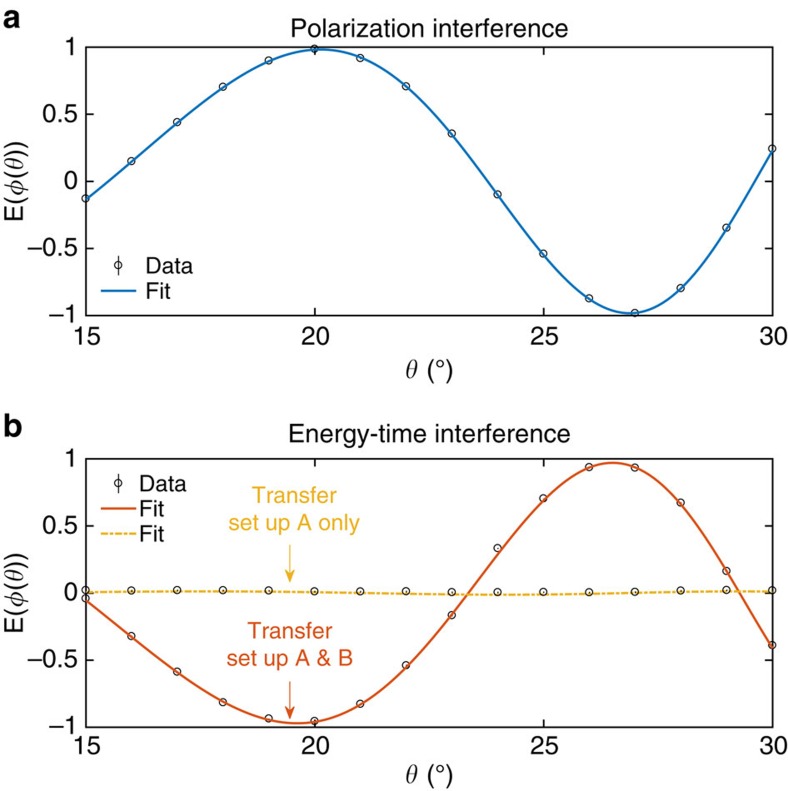
Figure 3. Experimental characterization of hyperentanglement.
Two-photon correlation functions in the polarization basis (a) and energy–time basis (b) as a function of the variable phase shift introduced in Alice’s measurement module. Each data point was evaluated from two-photon detection events accumulated over a 10 s integration time, without subtraction of accidental counts. The error bars that denote the 3-σ s.d. due to Poissonian count statistics are smaller than the data markers. The best fit functions (least-mean-square fit to the expected two-photon correlation in presence of experimental imperfections) exhibit visibilities  in the polarization basis (blue line) and
  in the energy–time basis (orange line). Almost no interference was observed when the energy–time to polarization transfer set-up was introduced in Alice’s detection module only (yellow line,
  ).
).

