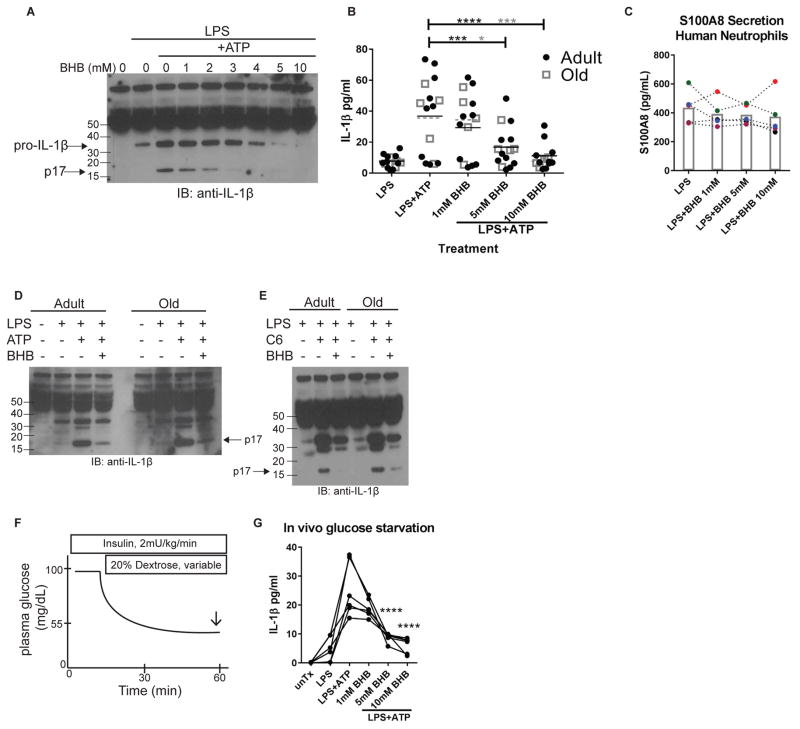
Figure 2. BHB regulates neutrophil NLRP3 inflammasome activation.
IL-1β secretion by stimulated (A) mouse and (B) human neutrophils. (C) Secretion of S100A8 from stimulated human neutrophils. Different colored symbols connected by dotted line represents a unique individual’s response to all treatments. Columns indicate the mean for each treatment. (D, E) Western blot analysis of IL-1β secretion of adult and old murine neutrophils. (F) Depiction of insulin-induced hypoglycemia in vivo; arrow indicates blood collection time point. (G) Neutrophil IL-1β secretion from hypoglycemic subjects. Lines connect the responses of each individual for each treatment condition. Statistical differences were calculated by paired 1-way ANOVA. See also Figure S2.

