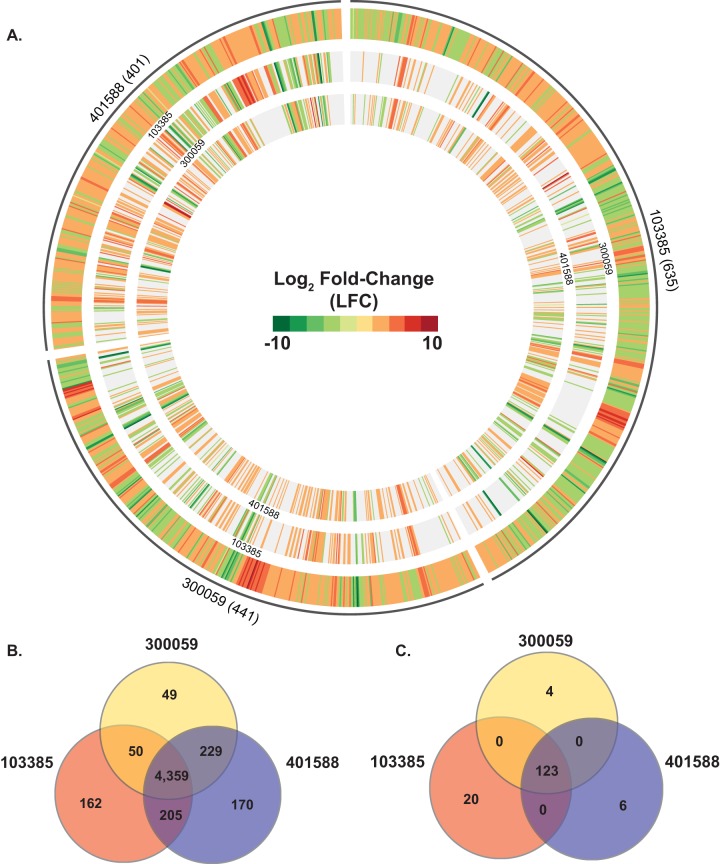
FIG 4 .
Comparison of the global transcriptomes of multiple EPEC isolates of the EPEC8 phylogenomic lineage. (A) Circular plot of the log2-fold-change (LFC) values for genes that exhibited significant differential expression during exponential growth in DMEM compared to LB. The outermost track contains all of the significant LFC values for one of the three EPEC8 isolates. The inner tracks contain the LFC values of genes of another of the EPEC8 isolates belonging to the same LS-BSR gene cluster as the genes in the outermost reference track. The genes that were not identified in the other EPEC8 isolates and/or did not exhibit significant differential expression are absent from the inner tracks. The number of genes that had significant differential expression is indicated in parentheses next to each isolate name. (B) The number of genes that were highly conserved (LS-BSR ≥ 0.8) in all four of the EPEC isolates is indicated in the center. The number of genes that were identified with significant similarity (LS-BSR ≥ 0.8) that also exhibited significant differential expression in two or three EPEC isolates is also designated. The number of isolate-specific genes indicates the genes that were identified with significant similarity in one EPEC isolate and that were divergent or absent from the other two EPEC8 isolates. (C) Venn diagram showing the number of genes differentially expressed for each of the EPEC8 isolates analyzed in this study grown to an OD600 of 0.5 in DMEM compared to LB. The number of core genes that were highly conserved (LS-BSR ≥ 0.8) in all three of the EPEC8 isolates that also exhibited significant differential expression in all of the EPEC8 isolates is indicated in the center. There were no genes that were present with significant similarity and also differentially expressed in only two of the three EPEC8 isolates. The number of isolate-specific genes indicates those genes that exhibited significant similarity (LS-BSR ≥ 0.8) that were divergent or absent (LS-BSR < 0.8) from the other two EPEC8 isolates and also exhibited significant differential expression during growth to an OD600 of 0.5 in DMEM compared to LB.

