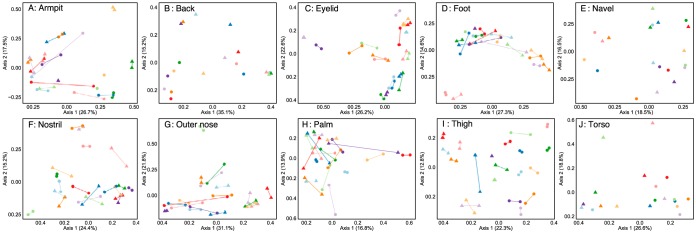
FIG 2 .
Ordinations (PCoA) generated by using the Bray-Curtis dissimilarity metric for each of the 10 body locations sampled. Lines connect samples from a participant. Female samples are denoted by circular points, whereas male partners are represented by triangles. Where a single sample per person was collected for specific body locations (i.e., back, navel, torso), no lines connect the participant samples. Samples from different couples are indicated by the different colors.

