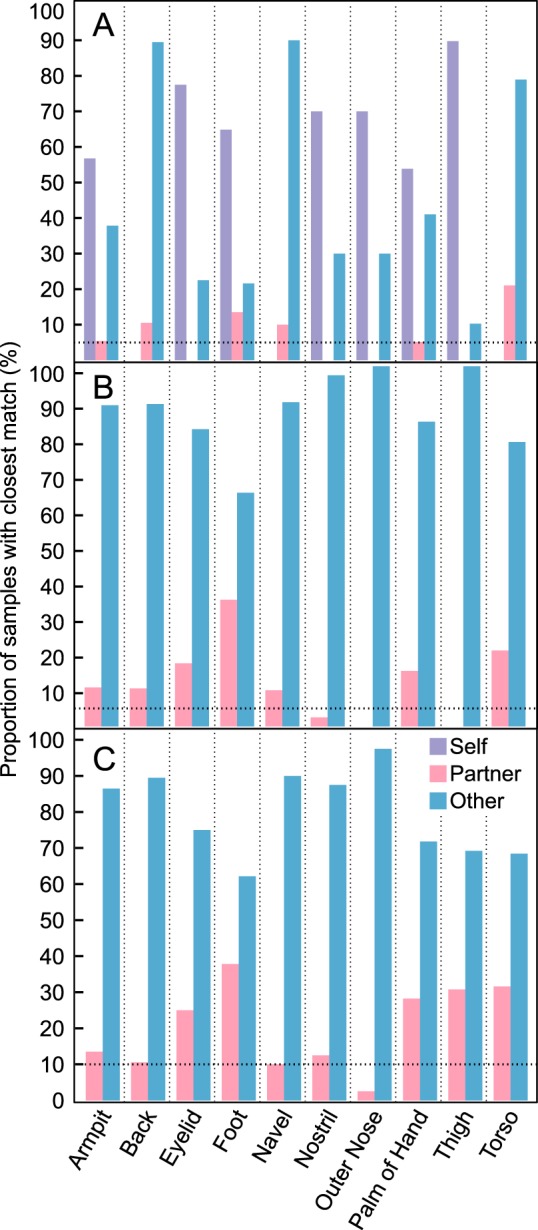
FIG 3 .

Samples were matched with another sample in the data set that possessed the most similar microbial community. Matches were analyzed to determine the percentage of samples belonging to self, partner, or another participant. (A) Proportion of samples that had the lowest Bray-Curtis distance with either another sample from within an individual, from within a cohabiting couple, or to any of the other participants. (B) Proportion of samples that had the lowest Bray-Curtis distance with nonself samples. (C) Proportion of samples that had the lowest Bray-Curtis distance with nonself, opposite-sex samples. The dotted line represents the threshold that would be expected by random chance from the 20 participants.
