Figure 5.

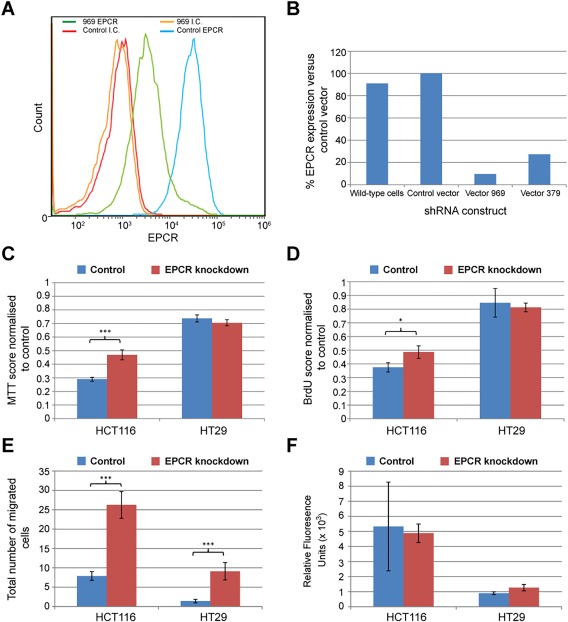
In HCT116 cells, EPCR knockdown with shRNA decreases chemosensitivity and increases migration. (A) Flow cytometry data confirming knockdown of EPCR expression with shRNA (vector 969) compared to control cells. (B) EPCR expression in wild‐type cells and shRNA transfected cells (vectors 969 and 379), as a percentage of control vector‐transfected cells. (C) MTT scores for control and shRNA knockdown (clone 969) HCT116 and HT29 cells after treatment with 5FU (32 μM), shown as a percentage of control cells. (D) BrdU scores for control and shRNA knockdown (clone 969) HCT116 and HT29 cells after treatment with 5FU (32 μM), shown as a percentage of control cells. (E) 48 h Transwell migration assay – number of cells that migrated through Transwell membrane for each clone in five counted regions. (F) 48 h QCM invasion assay. In panels (C‐F), asterisks represent statistical significance of EPCR‐low cells versus control cells (*p < 0.05, **p <0.01, ***p <0.001). Bars represent standard error.
