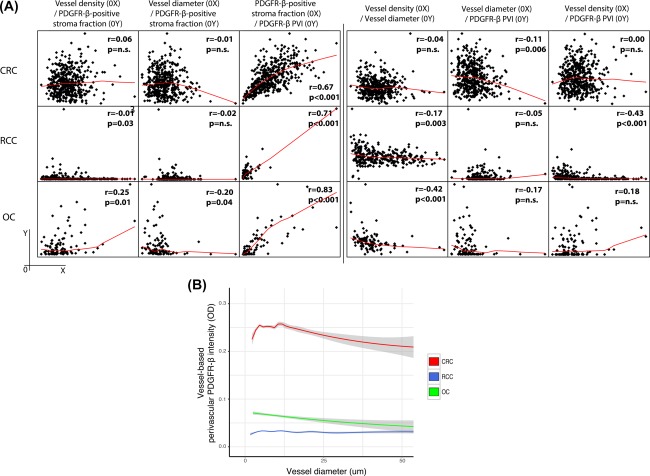
Figure 2.

Comparisons of CRC, RCC, and OC regarding correlations between different stroma features. (A) Panels illustrate pair‐wise correlation analyses of case‐based values for stroma features in CRC (upper), RCC (middle), and OC (lower). The left part contains analyses of the correlations between vascular features (vessel density, vessel diameter, and mean intensity of perivascular PDGFR‐β‐expression [PDGFR‐β PVI]) and abundance of PDGFR‐β‐positive tumour stroma (PDGFR‐β‐positive stroma fraction). The right part contains analyses of the correlations between the three different vascular features. For procedures used to obtained case‐based values for these stroma features, see Material and Methods section. (B) The graph illustrates the relationship between vessel diameter and perivascular PDGFR‐β‐intensity in vessels of CRC, RCC, and OC using vessel‐based values. For details concerning methods to obtain data for perivascular PDGFR‐β‐status and diameter of individual vessels, see Material and Methods.
