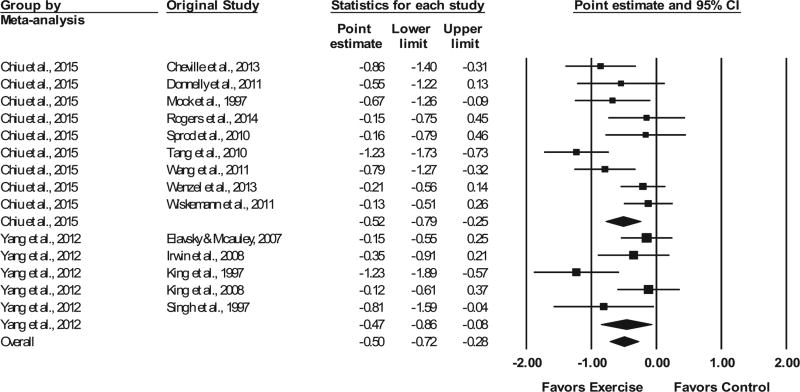
FIGURE 2.
Forest plot for changes in overall sleep quality. The black horizontal lines represent the 95% confidence intervals while the squares represent the point estimate. The first two black diamonds represent the overall point estimate and 95% confidence intervals from each meta-analysis, while the third black diamond represents the overall pooled point estimate and 95% confidence intervals from all individual studies included in each meta-analysis. All analyses are based on the random-effects model

