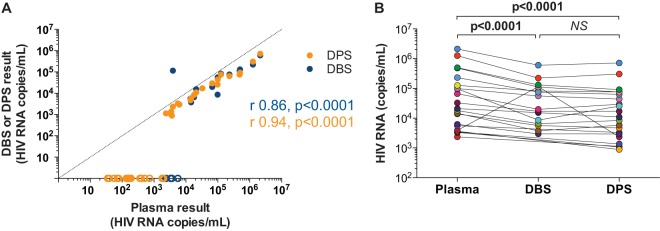
FIG 4.
HIV RNA measured in paired plasma samples, dried blood spots, and dried plasma spots. (A) HIV RNA as quantified in participants with detectable HIV RNA using the Aptima assay in paired plasma samples, DBS (blue circles), and DPS (orange circles) from 104 HIV-infected donors. Dotted line indicates an ideal correlation (y = x). Results of correlation analysis (Spearman r and P values) are shown for DBS (blue text) and DPS (orange text). Samples with undetectable HIV RNA in 1 or more replicates are assigned a conservative value of 0 copies/ml denoted by open circles. (B) Comparison of HIV RNA levels in samples with >1,000 copies/ml as measured in paired plasma (teal circles) against levels measured in DBS (blue circles) and DPS (orange circles). Undetectable DBS values are not shown; they are reported in the supplemental data (see Table S3 in the supplemental material).

