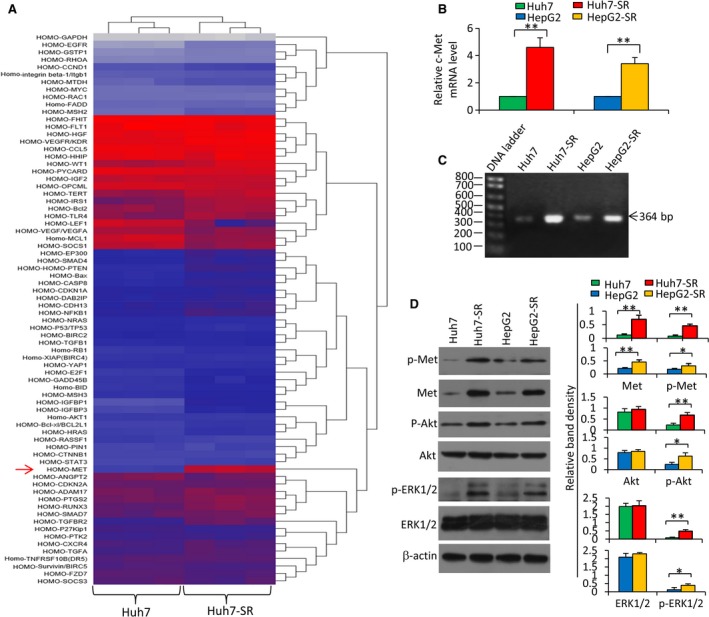
Figure 1.

Sorafenib‐resistant HCC cells express higher levels of c‐Met. Huh7, Huh7‐SR, HepG2, and HepG2‐SR cells were cultured for 48 h and harvested for analysis. (A) The hierarchical clustering analysis of differentially expressed genes was performed by using a Human liver cancer RT² Profiler™ PCR Array on Huh7 and Huh7‐SR cells. (B) The expression of c‐Met mRNA was measured by qRT‐PCR. The level of mRNA from parental cells was defined as 1. (C) PCR products (364 bp) generated from RT‐PCR for detecting c‐Met mRNA underwent a 2% agarose gel electrophoresis. (D) The above cells were immunoblotted. The density of each band was normalized to β‐actin. ‘*’ (P < 0.05) and ‘**’ (P < 0.001) indicate a significant difference.
