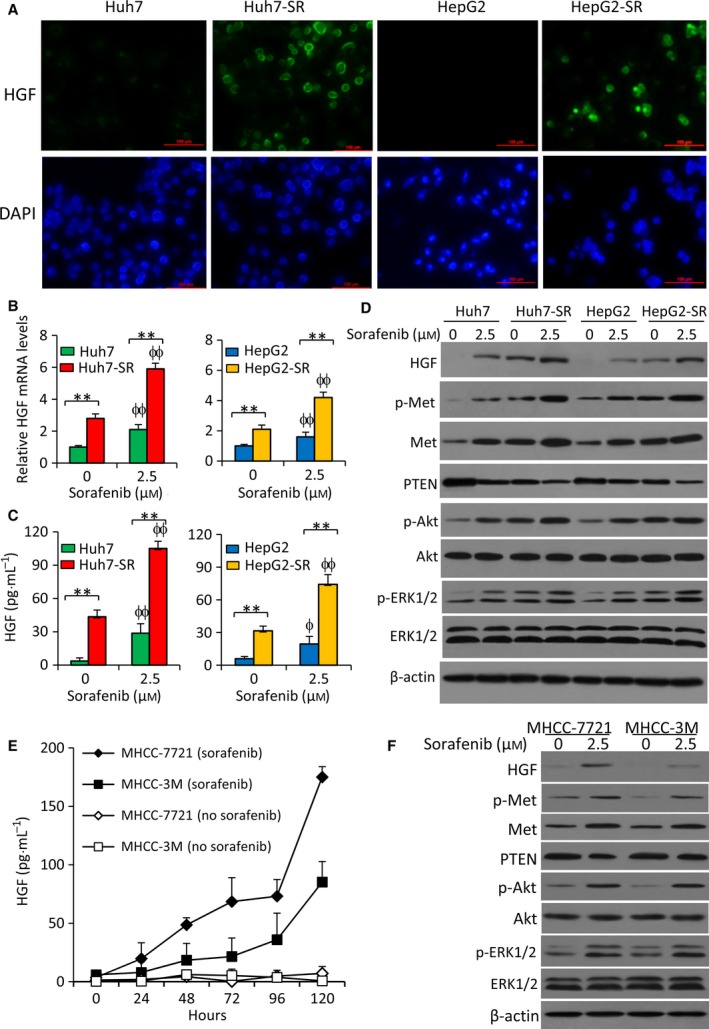
Figure 2.

Exposure to sorafenib activates the HGF/c‐Met and PTEN/Akt pathways in HCC cells. (A) Cellular expression of HGF was detected by immunofluorescence microscopy. HGF protein was stained by an anti‐HGF antibody (green), and the cell nuclei were stained blue by DAPI. (B–D) Cells were incubated in the absence or presence of sorafenib (2.5 μm) for 48 h. (B) The expression of HGF mRNA was measured by qRT‐PCR. The level of mRNA from untreated parental cells was defined as 1. (C) The levels of HGF protein in the culture media were measured by ELISA. (D) The above cells were subjected to immunoblotting. (E, F) MHCC‐7721 and MHCC‐3M cells were incubated in the absence or presence of sorafenib (2.5 μm) and harvested at indicated time points. (E) The levels of HGF protein in the culture media were measured by ELISA. (F) Cells harvested at 48 h were immunoblotted. ‘**’ (P < 0.001) indicates a significant difference. ‘ϕ’ (P < 0.05) and ‘ϕϕ’ (P < 0.001) indicate a significant difference from respective untreated cells.
