
Figure 2.
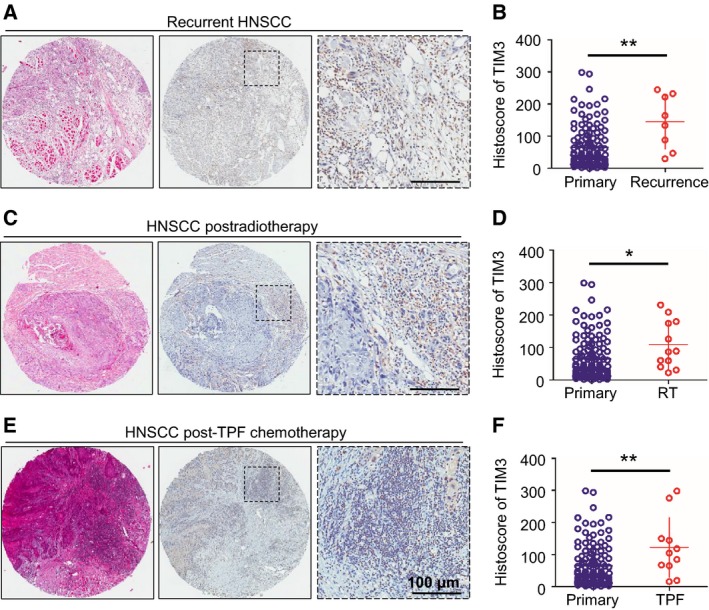
TIM3 expression in recurrent HNSCC, NSCC postradiotherapy, or post‐TPF chemotherapy. Representative pictures of hematoxylin/eosin staining and IHC staining of TIM3 in recurrent HNSCC (A), HNSCC postradiotherapy (C), and HNSCC post‐TPF chemotherapy (E), and quantification of histoscore showed the increased TIM3 expression in recurrent HNSCC (B) (n = 8), HNSCC postradiotherapy (D) (RT, n = 12), and HNSCC post‐TPF chemotherapy (F) (TPF, n = 11) as compared with that in primary HNSCC (n = 122) (*P < 0.05, **P < 0.01, t‐test).