
Figure 4.
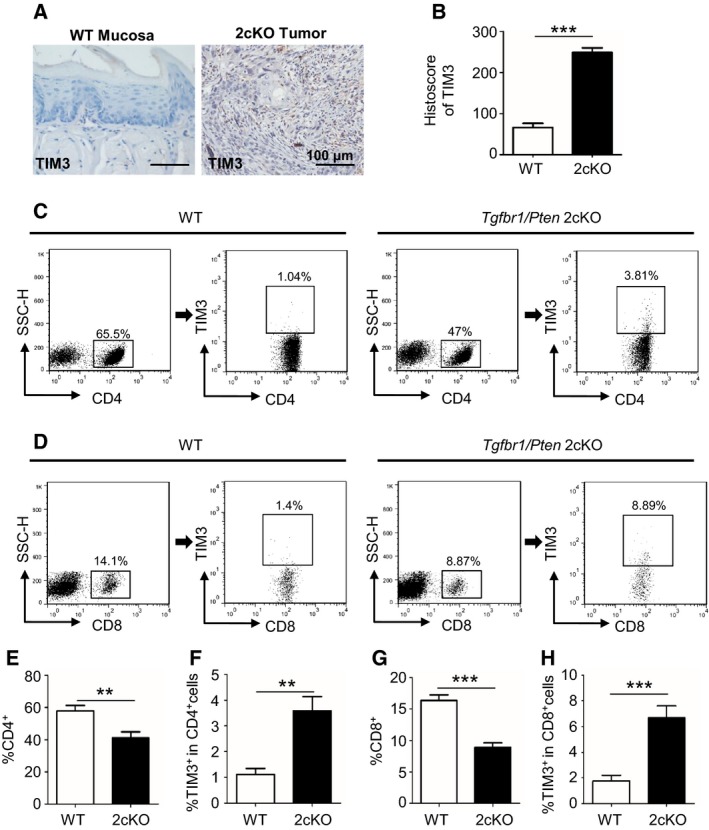
TIM3 expression is elevated, and effector T cells are reduced in the Tgfbr1/Pten 2cKO mouse HNSCC model. (A) Representative IHC staining of TIM3 in mucosa of wild‐type mice (left) and tumor of Tgfbr1/Pten 2cKO mice (right). (B) Histoscore of TIM3 expression in each group of mice (mean ± SEM, n = 6 mice, respectively, t‐test, ***P < 0.001). (C) The representative FACS plots of CD4+ cells and TIM3 expression on CD4+ cells from draining lymph nodes (LN) of WT mice and Tgfbr1/Pten 2cKO mice. (D) The representative FACS plots of CD8+ cells and TIM3 expression on CD8+ cells from LN of each group. The quantification of CD4+ cells ratio (E) and TIM3+ CD4+ cells ratio (F) in 2cKO tumor‐bearing mice as compared with wild‐type (WT) group. The quantification of CD8+ ratio (G) and TIM3+ CD8+ ratio (H) in the two groups (mean ± SEM, n = 6 mice, respectively, t‐test, *P < 0.05, **P < 0.01, ***P < 0.001).