Figure 6.

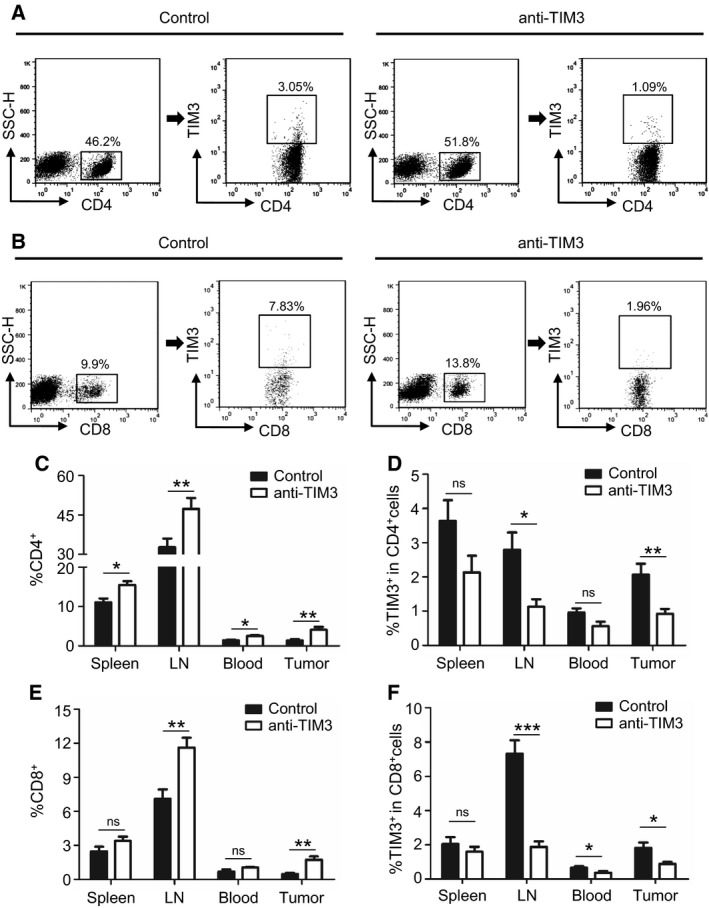
Blockade of TIM3 increases effector T cells in HNSCC mouse model through modulating the CD4+ TIM3+ cells and CD8+ TIM3+ cells. (A) The representative FACS plots of CD4+ cells and TIM3 expression on CD4+ cells in mice treated with either IgG or anti‐TIM3 mAb. (B) The representative FACS plots of CD8+ cells and TIM3 expression on CD8+ cells in mice treated with either IgG or anti‐TIM3 mAb. The quantification of CD4+ cells (C) and TIM3+ CD4+ cells (D) from spleen, draining lymph node (LN), blood, or tumor in each group of mice (mean ± SEM, n = 6 mice, respectively, t‐test, *P < 0.05, **P < 0.01). The quantification of CD8+ cells (E) and TIM3+ CD8+ cells (F) from spleen, LN, blood, and tumor in each group of mice (mean ± SEM, n = 6 mice, respectively, t‐test, *P < 0.05, **P < 0.01, ***P < 0.001).
