
Figure 2.
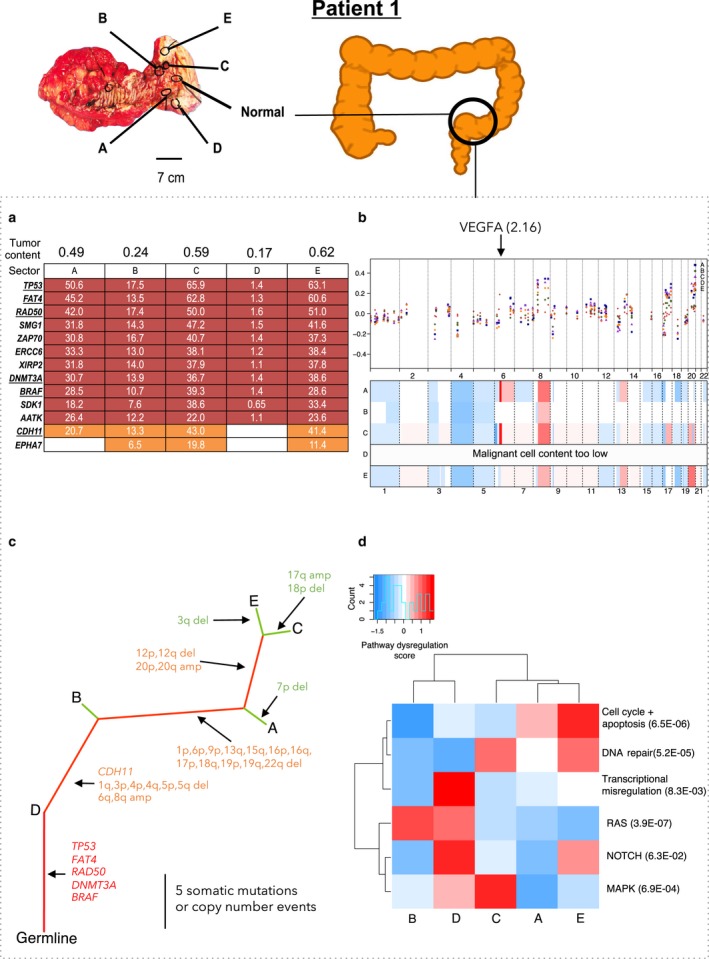
Patient 1 in stage IIIb with no localized metastasis. (a) Distribution of nonsynonymous (underlined) and synonymous mutations across sectors. VAF: variant allele frequency. Truncal mutations (those present in all sectors) are in red, branched mutations (nontruncal mutations shared by ≥ two sectors) are in orange, and private mutations (unique to one sector) are in green. (b) Copy number alterations in each sector of each tumor. First panel for each patient in which one dot for each sector shows the copy number ratio quantified for one of the 87 genes in the NanoString nCounter v2 Cancer CN Assay. The x‐axis indicates genomic position; the y‐axis indicates the normalized copy number ratio. The second panel for each sector is a heatmap showing ASCAT‐estimated copy numbers across the genome. White indicates copy number equal to the average ploidy of the sector; red indicates copy number gains; blue indicates copy number loss. Arrow indicates the location of the highly amplified VEGFA gene with the maximum copy number ratio of 2.16. Heatmap was plotted using R package CopyNumber. (c) Phylogenetic trees for the tumor sectors based on the detected mutations and copy number alterations. Color scheme for truncal, branched, and private mutations is in panel b. Nonsynonymous mutations and indels were indicated on the trunk and branches. (d) Significantly dysregulated pathways across the tumor sectors in each patient were identified using R package GAGE. Pathway scores and q‐values were calculated based on mRNA levels of the 800 genes in the NanoString Pan Cancer Pathways Panel Assay.