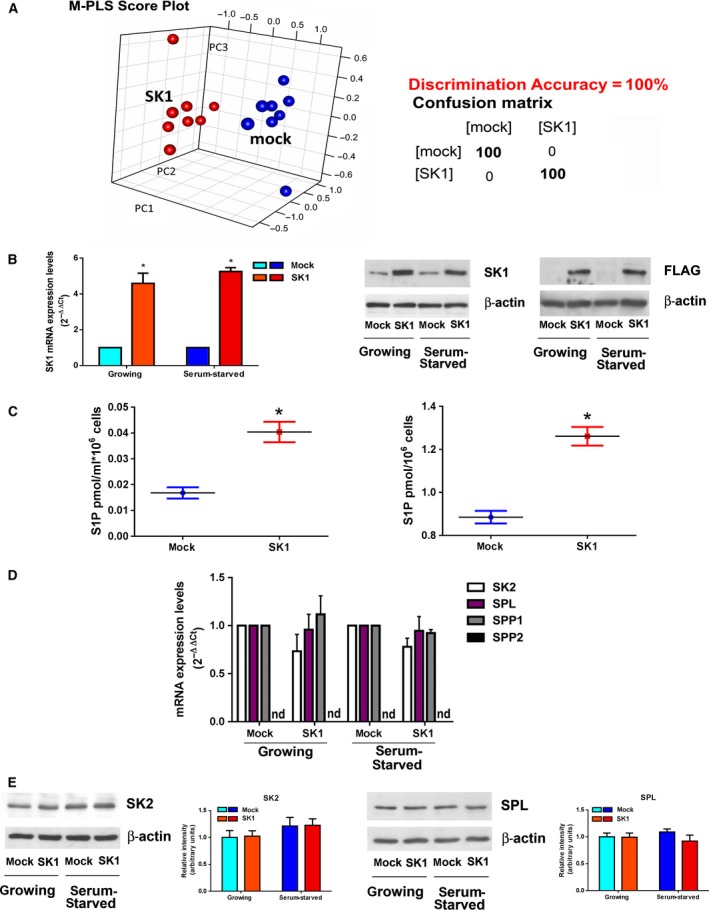
Figure 1.

SK1 overexpression in A2780 ovarian cancer cells. (A) Score plot of multilevel PLS discrimination of metabolomics profiles of mock‐ (blue dots) and SK1‐ (red dots) cell lysates. The plot was constructed using 1H‐NMR CPMG spectra. Right panel: cross‐validation paired test and confusion matrix for mock and SK1 samples; sensitivity of the test = 100%; specificity of the test = 100%. (B) Overexpression of SK1 tagged with FLAG M2 epitope. Left panel: quantitative analysis of SK1 mRNA by real‐time RT‐PCR as fold changes according to the 2−∆∆CT method. Data are reported as mean ± SEM of three independent experiments. The overexpression of SK1 in pcDNA3‐hSK1WT‐transfected compared to empty vector‐transfected cells was statistically significant by Student's t‐test, *P < 0.05. Central and right panels: SK1‐FLAG expression levels in stably transfected A2780 cells by WB analysis using specific monoclonal anti‐SK1 (central panel) and anti‐FLAG (right panel) antibodies. Equally loaded protein was checked by expression of β‐isoform of actin. (C) Mock‐ and SK1‐expressing cells were serum‐starved for 24 h before the media were collected (left panel) and cells harvested (right panel) and then subjected to S1P analysis. The effect of SK1 expression on S1P levels in the media and inside the cells was statistically significant by Student's t‐test *P < 0.05. (D) Quantitative mRNA analysis by real‐time PCR in total extracted RNA. SK2, SPL, SPP1, and SPP2 mRNA quantitation was based on the 2−∆∆CT method, using SK2, SPL, or SPP1 of the mock‐transfected specimen as calibrator. Data are the mean ± SEM of three experiments performed in triplicate. nd, not detected. (E) SK2 and SPL expression by WB analysis. Equally loaded protein was checked by expression of β‐isoform of actin. A blot representative of three independent experiments with analogous results is shown. Bar plots represent the densitometric analysis of at least three independent experiments. Data are the mean ± SEM and are reported as protein expression normalized to β‐actin, ‐fold change over control set as 1.
