Figure 2.

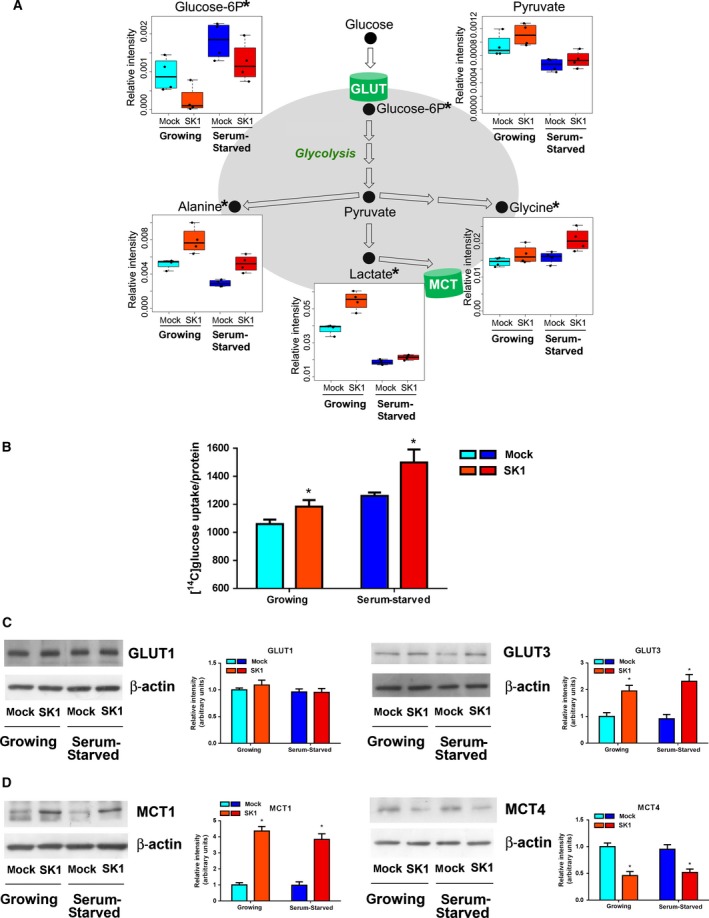
SK1 expression induces a glycolytic switch in A2780 ovarian cancer cells. A2780 mock and SK1 cells were cultured in growing medium or serum‐starved for 24 h. (A) Box plots: the relative concentration levels of the indicated metabolites in each group were calculated by integrating the signal area in the respective 1H‐NMR spectra. Changes in metabolite levels caused by SK1 overexpression were statistically significant by paired Wilcoxon test, *P < 0.05. (B) [14C]‐glucose uptake normalized on protein content. The increase in glucose uptake induced by SK1 expression was statistically significant by Student's t‐test, *P < 0.05. (C) Expression levels of GLUT1 and GLUT3 transporters by WB. Equally loaded protein was checked by expression of β‐isoform of actin. A blot representative of three independent experiments with analogous results is shown. Bar plots represent band intensity of GLUT1 and GLUT3 normalized to β‐actin and reported as mean ± SEM of three independent experiments, ‐fold change over control. The effect of SK1 expression was statistically significant by Student's t‐test, *P < 0.05. (D) MCT1 and MCT4 expression by WB. Equally loaded protein was checked by expression of β‐isoform of actin. A blot representative of three independent experiments with analogous results is shown. Bar plots represent the densitometric analysis of at least three independent experiments. Data are the mean ± SEM and are reported as protein expression normalized to β‐actin, ‐fold change over control (set as 1). The effect of SK1 expression was statistically significant by Student's t‐test, *P < 0.05.
