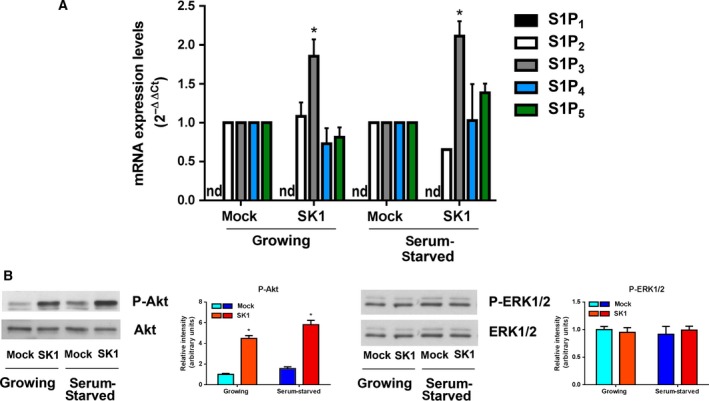
Figure 5.

SK1‐induced pathways in A2780 ovarian cancer cells. Ovarian mock and SK1 A2780 cells were cultured in growing medium or serum‐starved for 24 h. (A) Quantitative mRNA analysis by real‐time PCR in total extracted RNA. S1PR mRNA quantitation was based on the 2−∆∆CT method, using S1P2, S1P3, S1P4, or S1P5 of the mock‐transfected specimen as calibrator. nd, not detected. The increase in S1P3 expression in SK1‐expressing cells was statistically significant by Student's t‐test, *P < 0.05. (B) Cell lysates were analyzed by WB using specific anti‐phospho‐Akt, anti‐pan Akt, anti‐phospho‐ERK1/2, and anti‐pan ERK1/2 antibodies. Blots representative of at least three independent experiments are shown. Bar plots represent densitometric quantification of phosphorylated proteins normalized to their total content and reported as mean ± SEM of three independent experiments, ‐fold change over control set as 1. The effect of SK1 expression was statistically significant by Student's t‐test, *P < 0.05.
