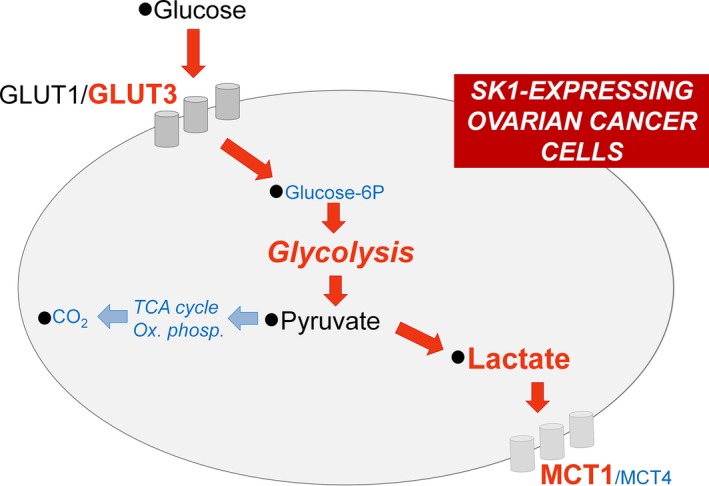
Figure 6.

Metabolic shift induced by SK1 expression in A2780 ovarian cancer cells. Red arrows represent augmented fluxes, while cyan arrows indicate diminished processes in consequence of SK1 expression. Metabolite/protein levels and metabolic pathways are shown in red or cyan if they are, respectively, augmented or decreased in SK1‐expressing ovarian cancer cells.
