
Figure 2.
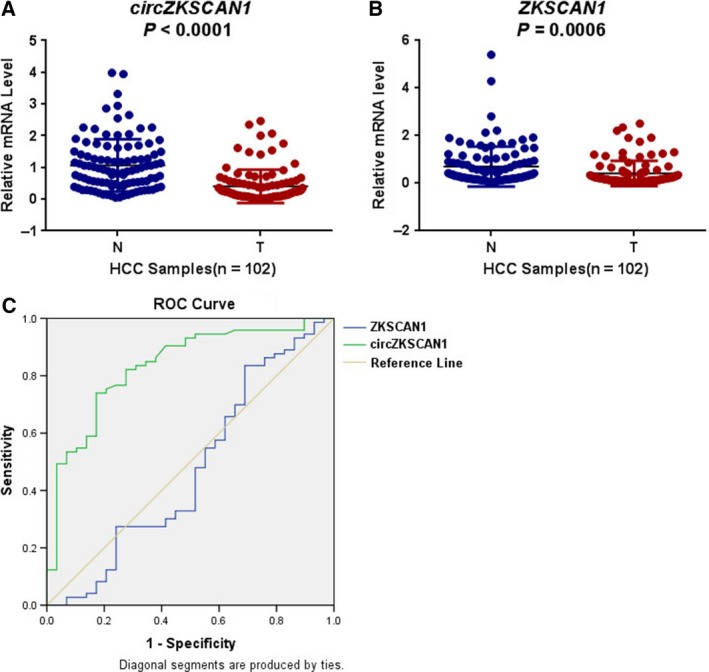
qRT‐PCR analysis of the expression of ZKSCAN1 and circZKSCAN1 and the ROC curves of ZKSCAN1 and circZKSCAN1. (A) The expression levels of circZKSCAN1 in each patient were significantly lower than those in the corresponding adjacent nontumorous tissues. P < 0.001. N: adjacent nontumorous tissue; T: hepatocellular carcinoma tissue. (B) The expression levels of ZKSCAN1 in each patient were significantly lower than those in the corresponding nontumorous tissues. *P < 0.05. N: adjacent nontumorous tissue; T: hepatocellular carcinoma tissue. (C) Comparisons of the ROC curves of circZKSCAN1,ZKSCAN1.