
Figure 3.
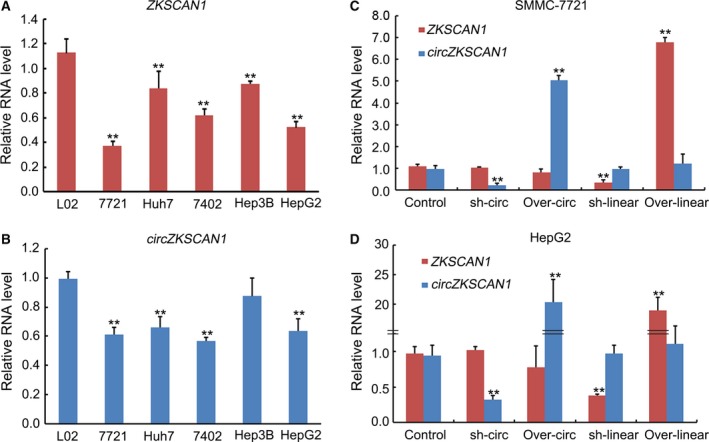
qRT‐PCR analysis of the expression of ZKSCAN1 and circZKSCAN1 with and/or without interferences in human HCC cell lines. (A) The expression levels of ZKSCAN1 in five HCC cell lines (Huh7 cell line, SMMC‐7721 cell line, BEL‐7402 cell line, HepG2 cell line, and Hep3B cell line) were significantly lower than those in the human normal hepatic L02 cell line. **P < 0.001. (B) The expression levels of circZKSCAN1 in five HCC cell lines (Huh7 cell line, SMMC‐7721 cell line, BEL‐7402 cell line, Hep3B cell line, and HepG2 cell line) were significantly lower than those in the L02 cell line. **P < 0.001. (C) The expression levels of ZKSCAN1 and circZKSCAN1 in the control, overexpression, and knockdown of circZKSCAN1 or ZKSCAN1 SMMC‐7721 cell line. (D) The expression levels of ZKSCAN1 and circZKSCAN1 in the control, overexpression, and knockdown of circZKSCAN1 or ZKSCAN1 in the HepG2 cell line.