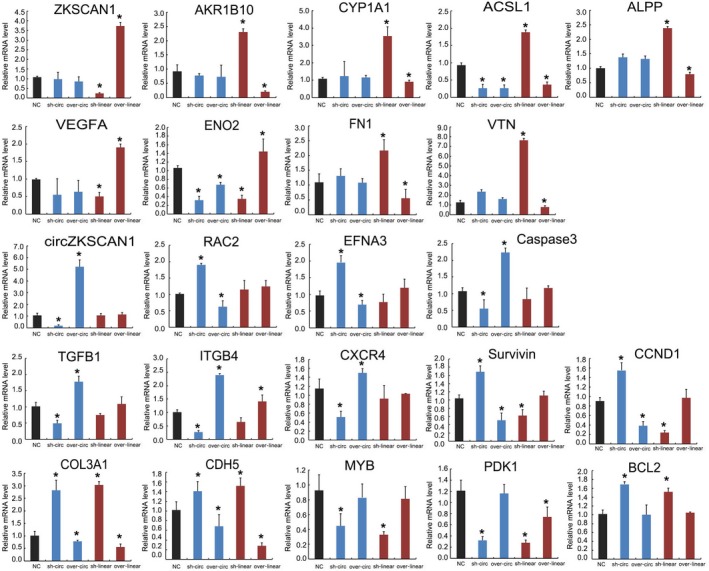
Figure 8.

qRT‐PCR analysis of the expression of 21 genes selected from the RNA‐seq results. Control: normal SMMC‐7721 cell line; sh‐circ: knockdown treatment of circZKSCAN1 in the SMMC‐7721 cell line; over‐circ: overexpression treatment of circZKSCAN1 in the SMMC‐7721 cell line; sh‐linear: knockdown treatment of ZKSCAN1 in the SMMC‐7721 cell line; over‐linear: overexpression treatment of ZKSCAN1 in the SMMC‐7721 cell line. The y‐axis shows the gene expression levels after normalization to the reference gene GAPDH. *P <0.05, compared with NC.
