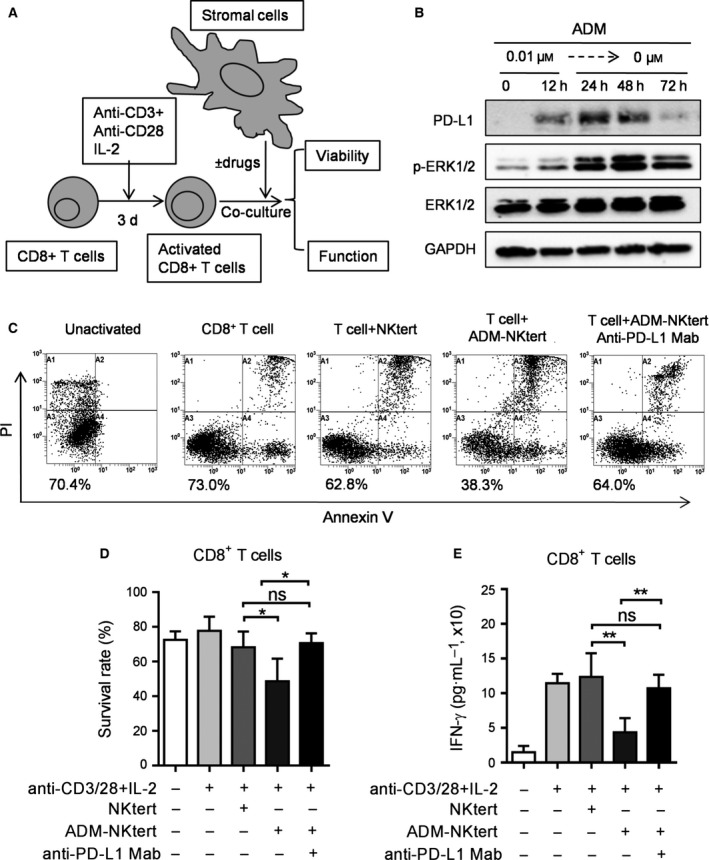
Figure 4.

Effect of drug‐induced PD‐L1 expression on T‐cell viability and function. (A) Schematic illustration of experiments to evaluate drug‐induced PD‐L1 expression on activated T cells. (B) NKtert cells were treated without or with 0.01 μm ADM for 12 h, the drug‐treated cells were then switched to fresh medium for another 24–72 h, as indicated. Cell lysates were analyzed by western blot for the PD‐L1, p‐ERK1/2, ERK1/2 and GAPDH expression. (C) Annexin V–PI assay of CD8+ T‐cell viability after cultured alone, co‐cultured with NKtert, ADM‐treated (0.01 μm, 12 h) NKtert and ADM‐treated Nktert + anti‐PD‐L1 IgG (5 μg·mL−1) for 48 h. Results from a representative experiment are shown in (C). The number (%) below each flow cytometry panel indicates % of viable cells (Annexin V–PI double negative). (D) Quantitative results of at least three separate experiments, as described in (C). Each bar indicates mean ± SD. *P < 0.05. (E) IFN‐γ production by activated CD8+ T cells was detected by ELISA assay after co‐culture with control NKtert, ADM‐treated (0.01 μm, 12 h) Nktert cells or ADM‐treated Nktert cells + anti‐PD‐L1 IgG (5 μg·mL−1) for 48 h. Data shown are mean ± SD, *P < 0.05, **P < 0.01.
