
Figure 3.
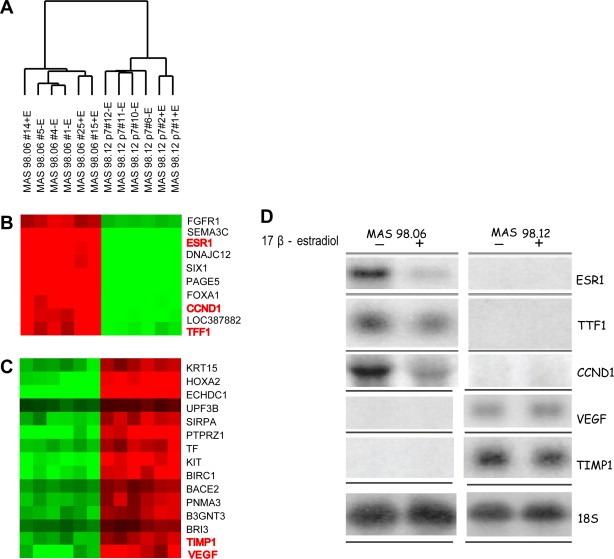
Expression analysis of xenografts. A) Unsupervised hierarchical clustering of 12 breast carcinoma xenografts across 18.442 genes which passed the filtering criteria (Fig. S1). B–C) Selected panels of differential gene expression between MAS98.06 and MAS98.12 xenografts. Genes in red were investigated by Northern blotting. D) Northern blot analysis of genes differentially expressed in two representative MAS98.06 and MAS98.12 xenografts from mice maintained with and without estradiol after implantation.