
Figure 6.
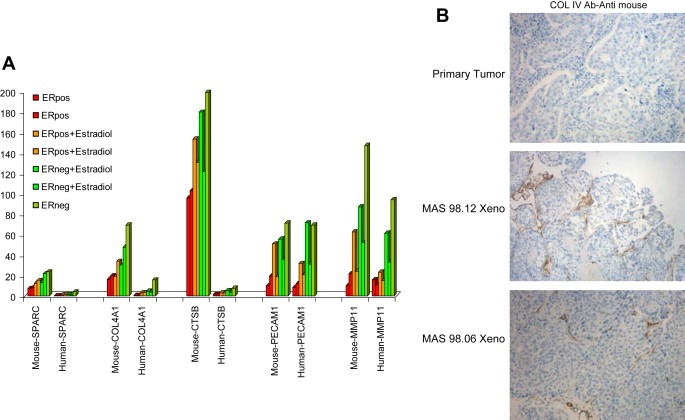
A) qRT‐PCR analysis of 5 ECM‐related genes. Expression levels were normalized against GAPDH using species‐specific primer for mouse and human. Representative xenograft samples are shown. B) Representative IHC staining for COLIV carried out in formalin‐fixed paraffin‐embedded sections of primary tumors and xenografts.