
Figure 7.
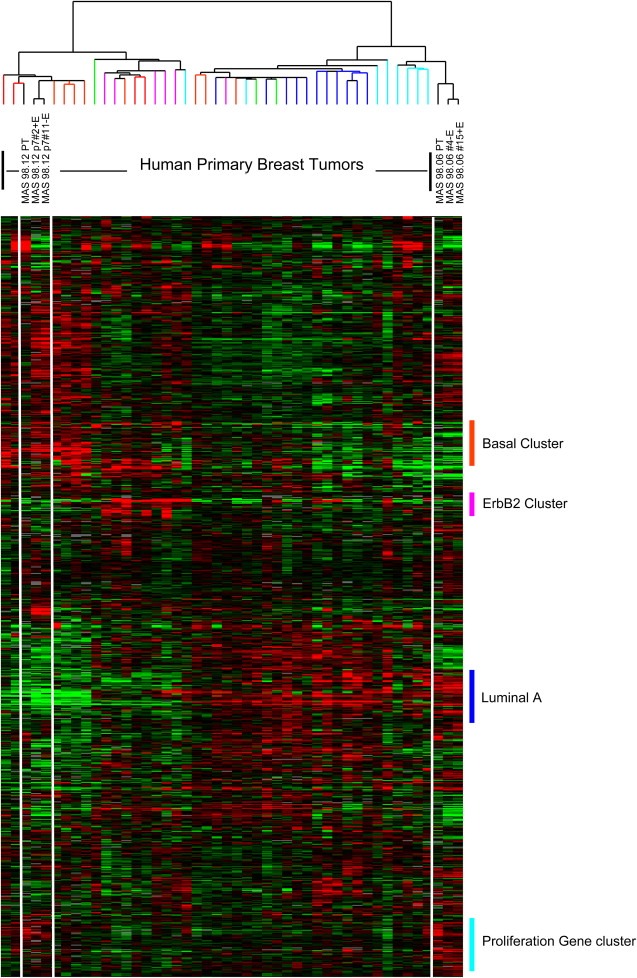
Expression patterns of “intrinsic molecular subtypes genes” in xenografts and primary tumors. 40 primary tumors were included in the analysis along with two representative xenograft replicates and their primary tumors. 822 clones corresponding to the original intrinsic genelist were clustered. Sample dendrogram branches are color‐coded based on centroid classification (Sorlie et al., 2003). Colored vertical bars indicate gene clusters typical for the different subtypes.