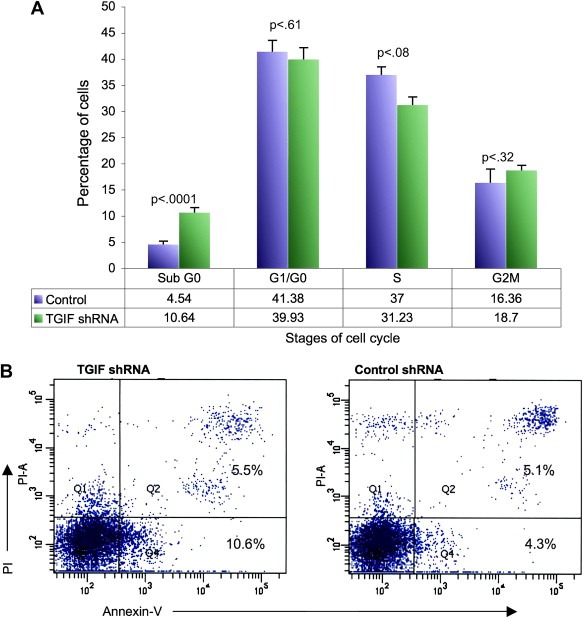
Figure 2.

(A) Cell cycle analysis of exponentially growing TGIF knockdown HL60 cells. Cells were stained with PI and analyzed by flow‐cytometry. The histograms represent the mean of three separate experiments showing the cell cycle percentage of the isolated HL60 clones. SubG0 percentages likely represent apoptotic cells. Control cells were HL60 cells transduced with non‐mammalian shRNA. Error bars represent SEM. P values were calculated using students t‐test with the help of Prism 5 statistical suite. (B) Annexin V and PI staining of the TGIF knockdown HL60 cells. The x‐axis shows Annexin V‐FITC binding and the y‐axis staining of the vital dye PI. Cells in the lower left quadrant are viable, cells in the lower right are early apoptotic and those in the upper right are late stage apoptotic/dead cells. The numbers represent the percentage of cells present in each quadrant. Results from one typical experiment are shown. Each experiment was repeated three times.
