
Figure 4.
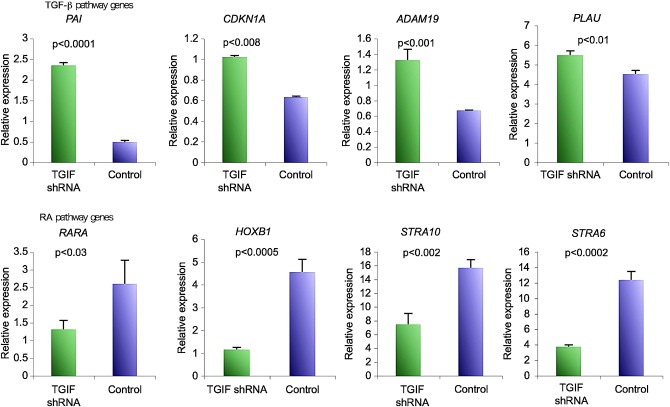
Expression levels of TGF‐β and RA target genes in TGIF knockdown HL60 cells as measured by relative real‐time PCR. TGF‐β target genes are up‐regulated while RA target genes are down regulated as compared to control shRNA‐transduced HL60 cells. Experiment was done in triplicate and repeated twice; the results of one representative experiment are shown. Error bars represent SEM. P values were calculated using students t‐test with the help of Prism 5 statistical suite.