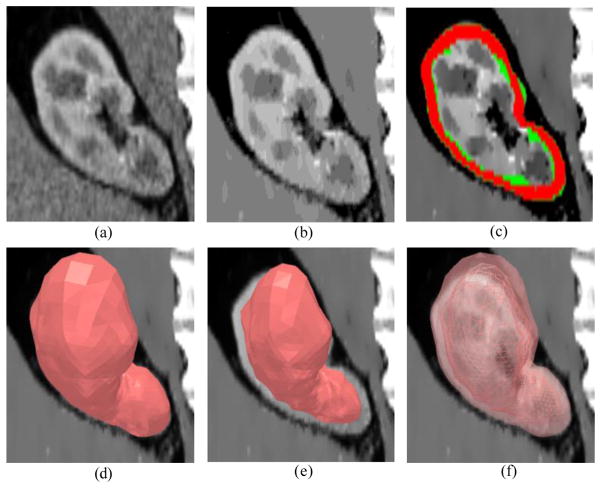
Fig. 4.
Surface segmentation results. (a) Original image. (b) Enhanced image using nonlinear diffusion filtering. (c) Red region indicates the renal cortex segmentation result, while the reference segmentation is in green. (d) Outer surface mesh. (e) Inner surface mesh. (f) Combined segmented outer surface (translucent surface) and inner surface (wire frame).

