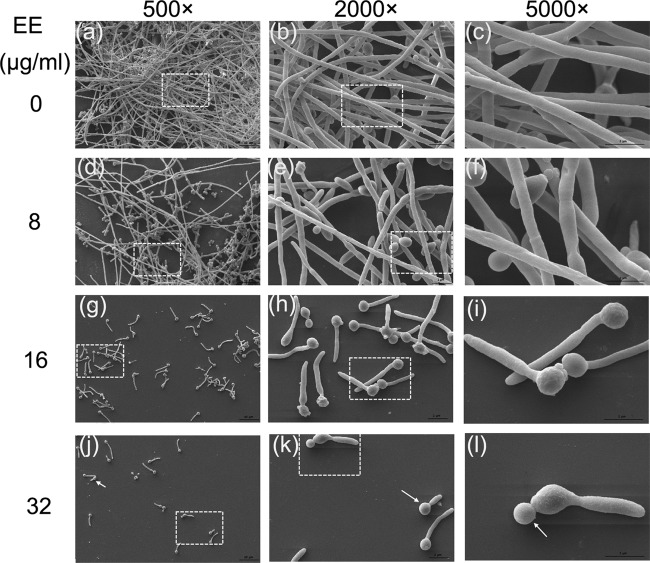
FIG 5.
SEM images show C. albicans biofilm inhibition under treatment with different concentrations of EE. Each treatment group was visualized under magnifications of 500×, 2,000×, and 5,000×. The boxes with dashed lines in the first and second columns are the areas enlarged in the second and third columns, respectively.

