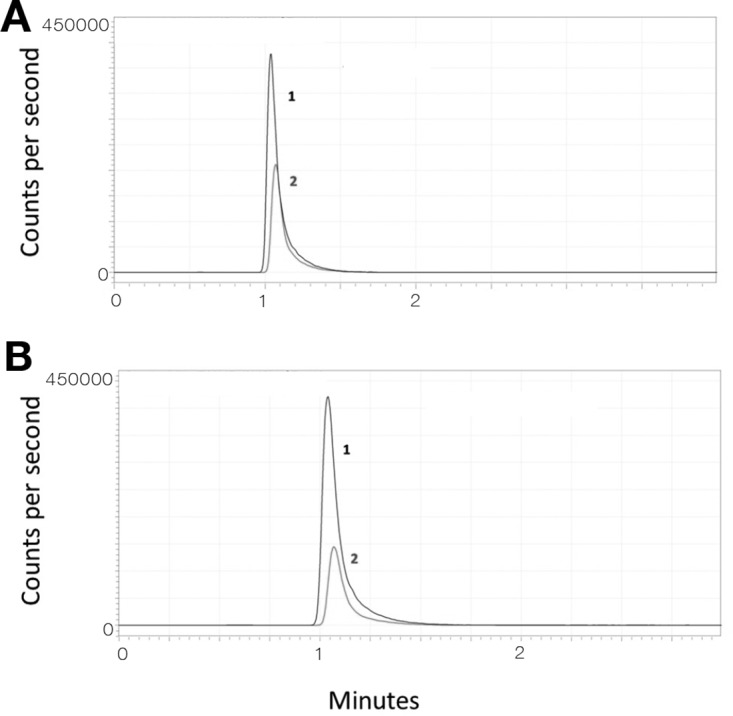
FIG 4.

Chromatograms showing penicillin G (peak 2; gray) in plasma (panel A; 6.4 mg/liter) and dried blood spot (panel B; 5.9 mg/liter) samples from an adult patient. Peak 1 (black) represents the internal standard (penicillin G d7). The intensity of background noise in blank plasma and DBS was generally <200 cps (y axis).
