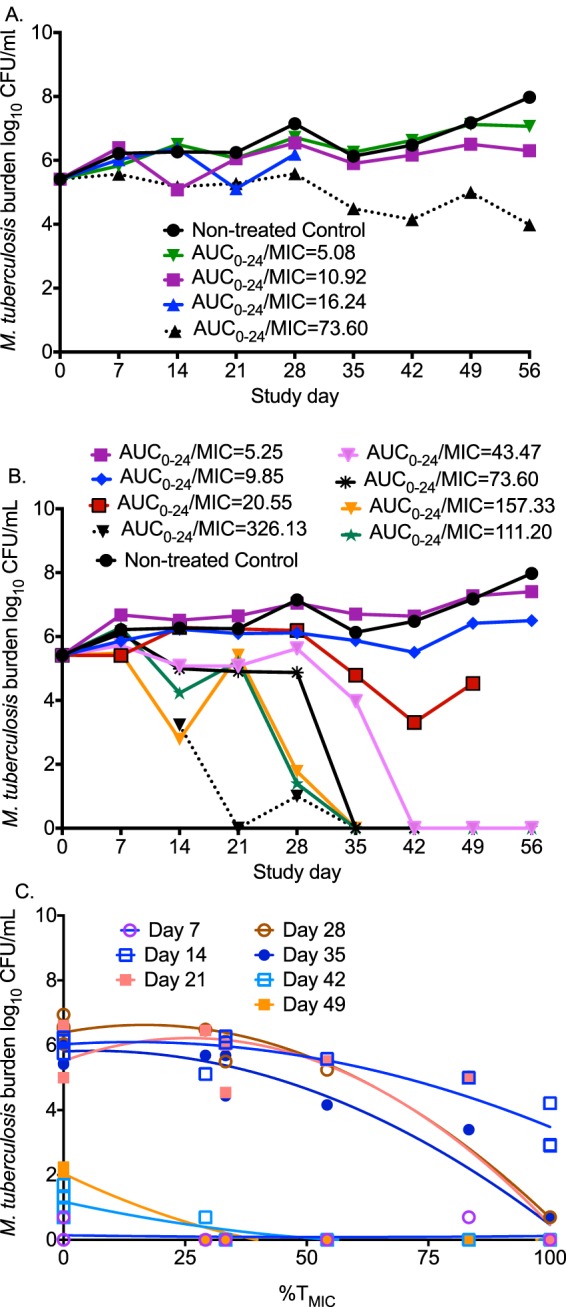
FIG 2.

Linezolid kill curves for sterilizing activity and acquired drug resistance. (A) Time-kill curves for the once-daily dosing schedule show that an AUC0–24/MIC ratio of ≥73.6 killed to levels below day 0 bacterial burden (stasis line). (B) Time-kill curves with the twice-daily dosing schedule demonstrate bacterial burden below limits of detection in hollow fiber cartridges at high AUC0–24/MIC ratios. (C) The relationship between exposure and drug-resistant subpopulation is a system of changing U-shaped curves. The best fit for this quadratic function was with the percentage of time that the concentration persists above the MIC (%TMIC). A %TMIC of 100 suppressed the linezolid-resistant subpopulation.
